25.5 - Plotting a Graph
What a graph question looks like
- A typical practical graph question provides a table of results and asks to plot them on a grid.
The four fixed marks every graph question carries
- Label both axes with the quantity and unit in the order specified (1 mark).
- Choose scales so the plotted points occupy at least half the grid across and up (1 mark).
- Plot every point accurately to within half a small square of its true value (1 mark).
- Draw a single, thin, well-judged line (1 mark).
Read the instructions in the question
Two marks depend directly on instructions printed in the question:
- Which quantity goes on which axis
- Whether to start the axes at the origin (0,0)
A typical question
Plot a graph of / Ω (y-axis) against / cm (x-axis). Start both axes at the origin (0,0). [4]
Setting up the axes
Which quantity goes where
- The quantity named first, before "against", goes on the y-axis (vertical).
- The quantity named after "against" goes on the x-axis (horizontal).
- Always follow the question's instructions rather than general convention, especially when a derived quantity (such as ) is requested.
Labelling
- Label each axis with the quantity and its unit, written as quantity / unit (e.g. , ).
- Either the full name or the recognised symbol is accepted.
- A unit alone or a quantity alone loses the mark, unless the quantity has no unit.
Starting at the origin
- "Start both axes at the origin (0,0)" - Both axes must begin at zero.
- "You do not need to start your axes at the origin (0,0)" - Begin at a convenient round number just below your smallest reading so the points aren't squashed into a corner.
- If the question doesn't specify, choose whichever option fills the grid better.
Choosing the scale and plotting the points
A scale that fills the grid
- Plotted points must occupy at least half the grid in both directions.
- Use convenient intervals per large square: 1, 2, 5, or 10 units (or powers of ten times these). Avoid intervals of 3 or 7.
- Scales must be linear with equal intervals along the whole axis.
Plotting points
- Plot each reading as a small, sharp cross.
- Every point must be plotted within half a small square of its true value.
- Don't use large dots or blobs, as they obscure the exact position of the point.
Worked example - Plotting spring extension
A student hangs loads on a spring and measures its extension. Plot extension (y-axis) against load (x-axis), starting both axes at the origin.
| Load / N | Extension / cm |
|---|---|
| 1.0 | 2.1 |
| 2.0 | 4.0 |
| 3.0 | 6.2 |
| 4.0 | 8.1 |
| 5.0 | 10.0 |
| 6.0 | 12.1 |
Step 1 - Set the x-axis (load)
-
Load reaches 6.0 N; the grid is twelve large squares across.
-
0.5 N per large square spans across the full width of the grid.
Step 2 - Set the y-axis (extension)
-
Extension reaches 12.1 cm; the grid is sixteen large squares tall.
-
1 cm per large square reaches over three-quarters of the grid height.
Step 3 - Check the scales
-
Both axes extend well past the required half-grid.
-
With ten small squares per large square, each small square represents 0.05 N horizontally and 0.1 cm vertically.
Step 4 - Plot each reading as a cross
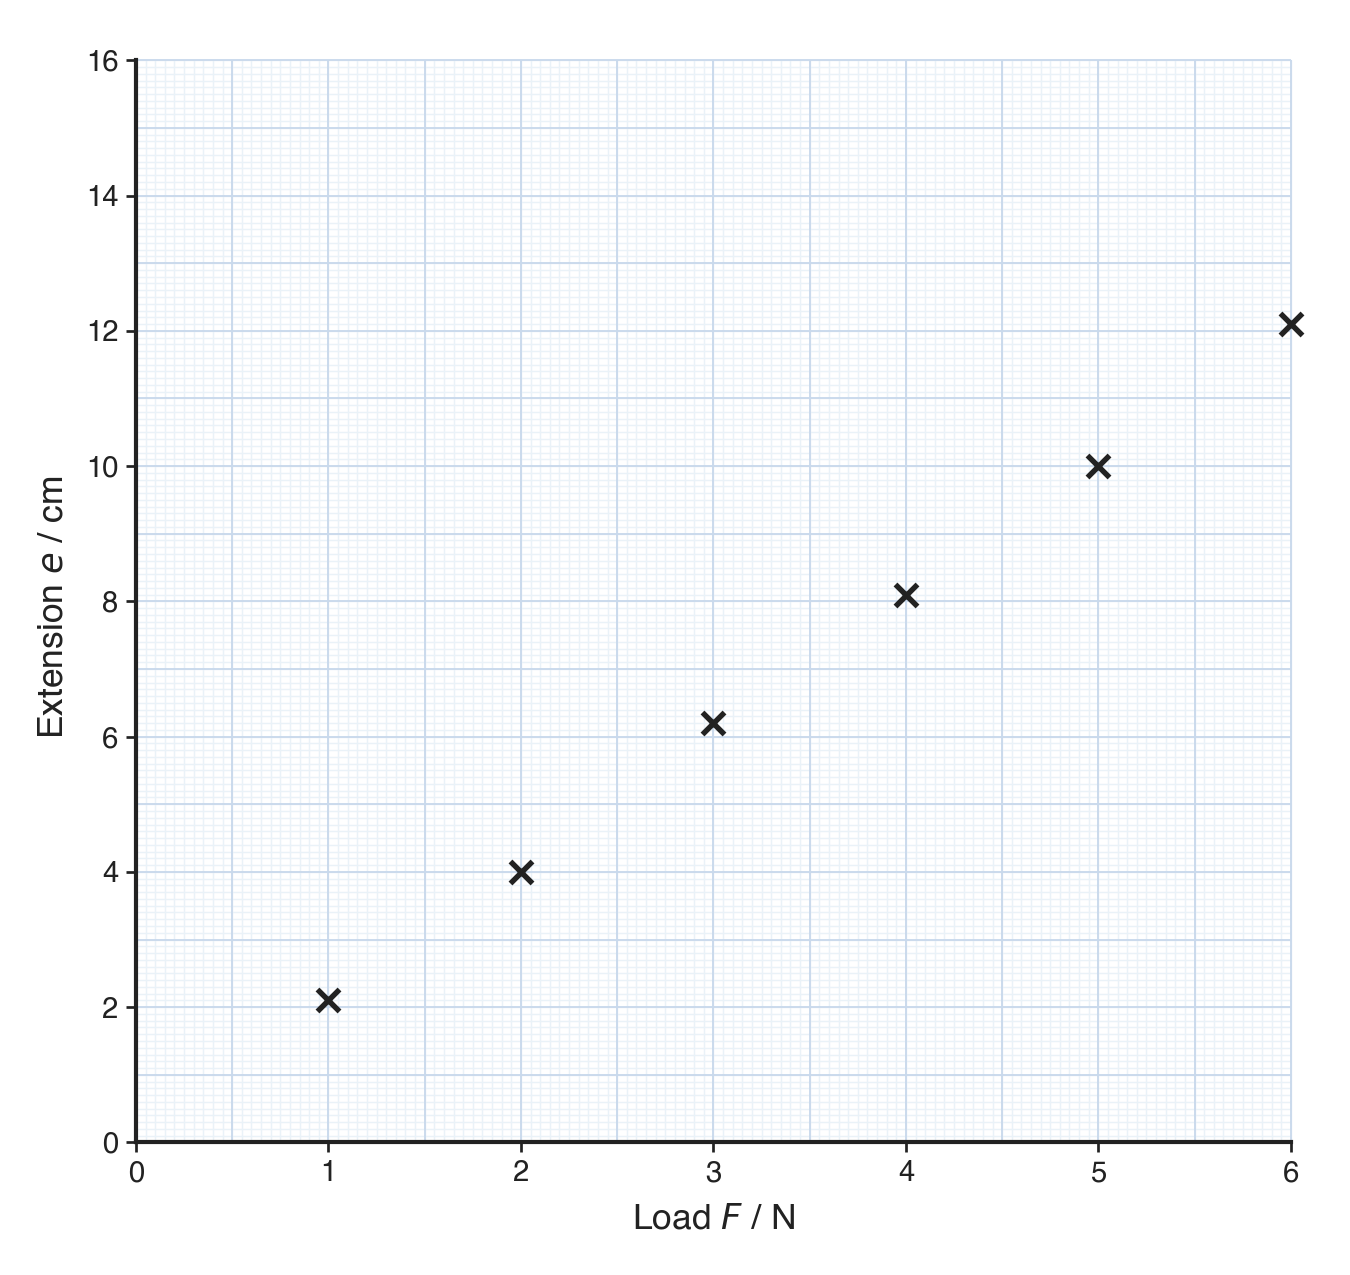
No line is drawn yet; the line of best fit comes next.
Drawing the line
Cambridge requires a single, thin, well-judged line:
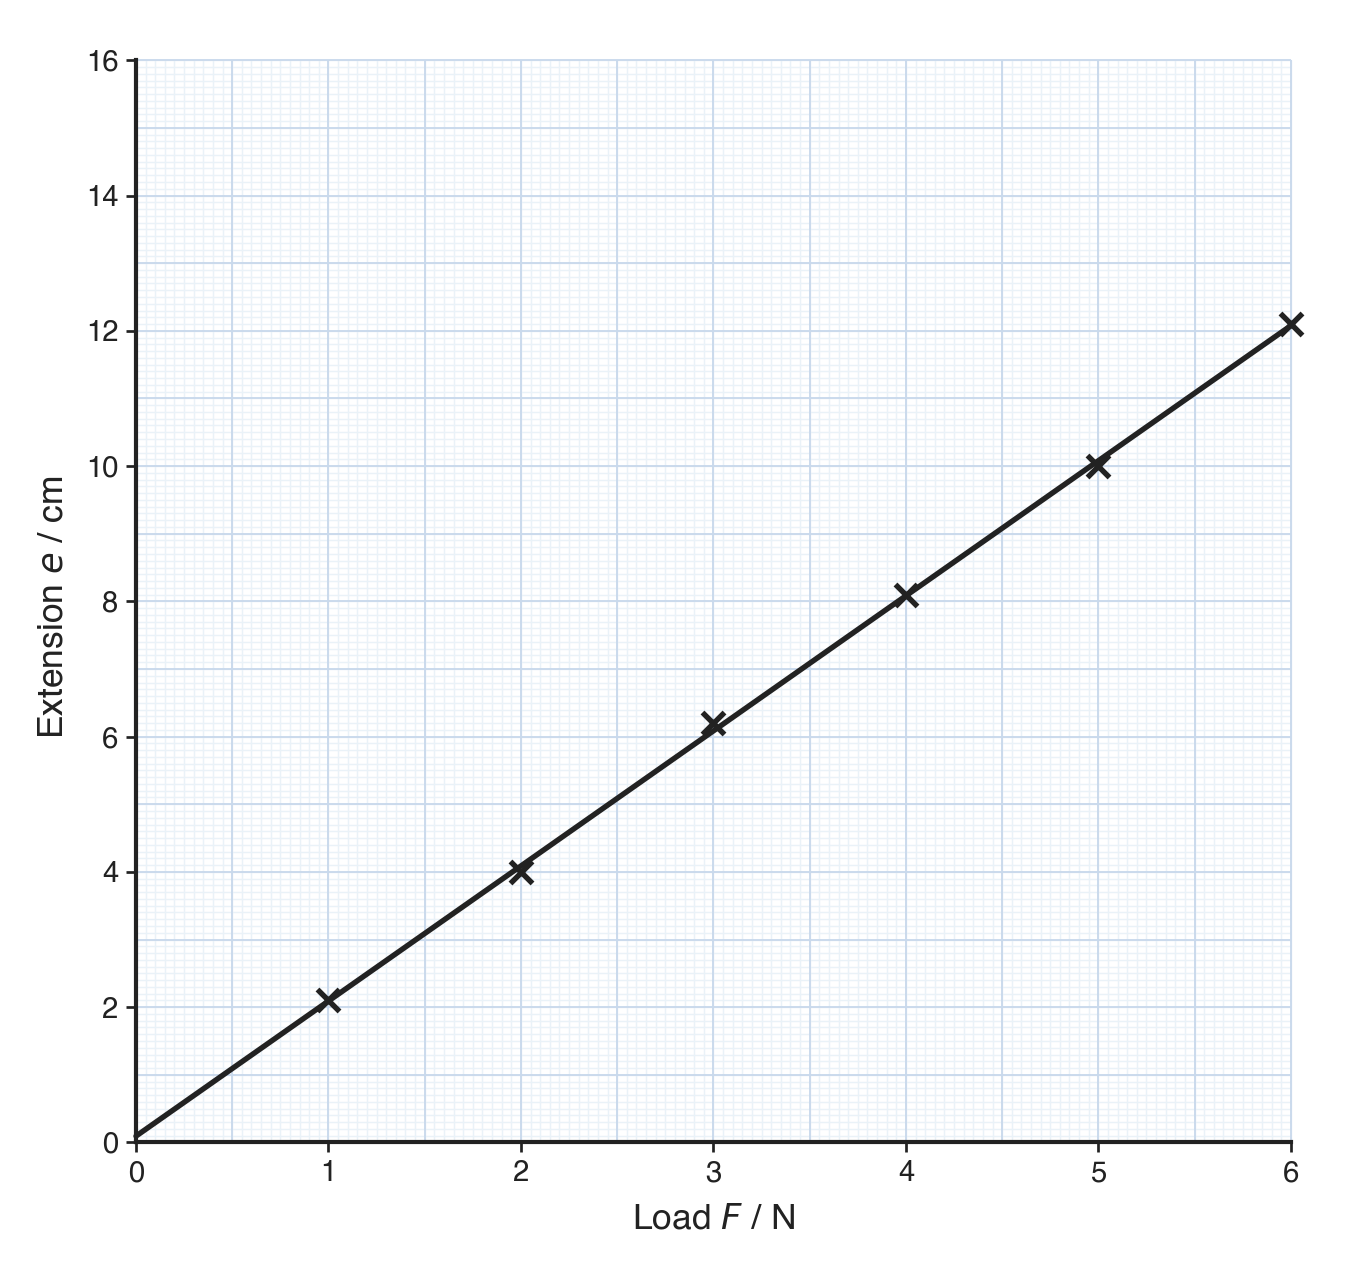
- If the trend is linear, draw a straight line of best fit using a ruler.
- If the points curve, draw a smooth curve freehand in one continuous stroke.
- The line doesn't need to touch every point, but should have an even balance of points above and below it.
Line quality
- Draw a single, sharp pencil line. Don't use sketchy, feathered, or thick lines.
- If you need to correct a line, erase the old one completely before redrawing.
Dealing with anomalous points
- If a point lies well away from the trend, ignore it when drawing the line of best fit.
- Don't erase the anomalous point; it has already earned its plotting mark.
Common exam questions
Question 1
A question says "plot a graph of / V (y-axis) against / cm (x-axis)". Which quantity goes along the bottom?
The length , in centimetres. The quantity named after the word "against" goes on the x-axis.
Question 2
What are the four things a Cambridge graph is marked on?
Axes labelled with quantity and unit and the right way round; scales chosen so the plots fill at least half the grid in both directions; every point plotted to within half a small square; and a single thin, well-judged line.
Question 3
A graph scored 2 of the 4 marks. The axes were labelled correctly and the points were accurate crosses. Suggest what lost the other two marks.
The scale, if the points did not fill at least half the grid or the scale was not linear; and the line, if it was thick, wavering, drawn dot-to-dot, or clearly not the best line through the points.
Question 4
A student's axis reads 0, 10, 20, 50, 100. Why does this score nothing for the scale?
Because it is not linear. Equal distances along the axis have to represent equal changes in the quantity, and here they do not.
Question 5
Why should you plot each point as a small sharp cross rather than a filled dot?
Because the mark requires each point to be within half a small square of its true value, and a blob hides where the point actually is, so the examiner cannot check it.
Question 6
One point lies well away from the trend of the others. What should you do?
Draw the line through the other points without bending it to reach the odd one, and leave the odd point plotted where it is. It has already earned its plotting mark, and moving or deleting it hides evidence.
Question 7
A question says "you do not need to start your axes at the origin (0,0)". Your readings run from 30.2 to 34.6 cm. What should you do?
Start that axis at a round value just below the smallest reading, such as 30, so the data spreads across the grid. Starting at zero would squash all six points into a narrow band and cost the scale mark.
Question 8
Why does a question sometimes ask for a graph against rather than against ?
Because plotting against the reciprocal turns a curved relationship into a straight line, which is easier to draw accurately and lets you take a gradient from it.
Question 9
A student joins their plotted points with short ruled segments, making a zig-zag. Why does this not score the line mark?
Because the readings scatter slightly around the true relationship, and the line's job is to show that relationship through the scatter. A line that changes direction at every point follows the scatter instead of the trend.