25.6 - Finding the Gradient & Reading a Graph
How gradient questions are marked
- When asked to determine the gradient, the question usually adds: "Show clearly on the graph how you obtained the necessary information."
- This isn't just advice - two of the four marks depend on it.
Mark breakdown for gradient questions
- Draw a triangle on the graph showing the two points used (1 mark).
- Make the triangle cover at least half the line between the outermost plotted points (1 mark).
- Show the calculation as with the values substituted (1 mark).
- Calculate a value within the accepted range (1 mark).
A typical question
Determine the gradient of the graph. Show clearly on the graph how you obtained the necessary information. [4]
The triangle method
The gradient of a straight line is the change in the vertical quantity divided by the change in the horizontal quantity:
Find and by drawing a right-angled triangle against the line of best fit.
Rules for drawing the triangle
- Read from the line, not the plotted points. The line represents the trend of the data. Choose two points directly on the line, ideally where it crosses grid intersections.
- Make the triangle large. It must cover at least half the line between the outermost points. A larger triangle reduces the percentage uncertainty from reading coordinates off the grid.
- Show the working. Write down the values of and and show the subtraction.
Worked example - Gradient of a load-extension graph
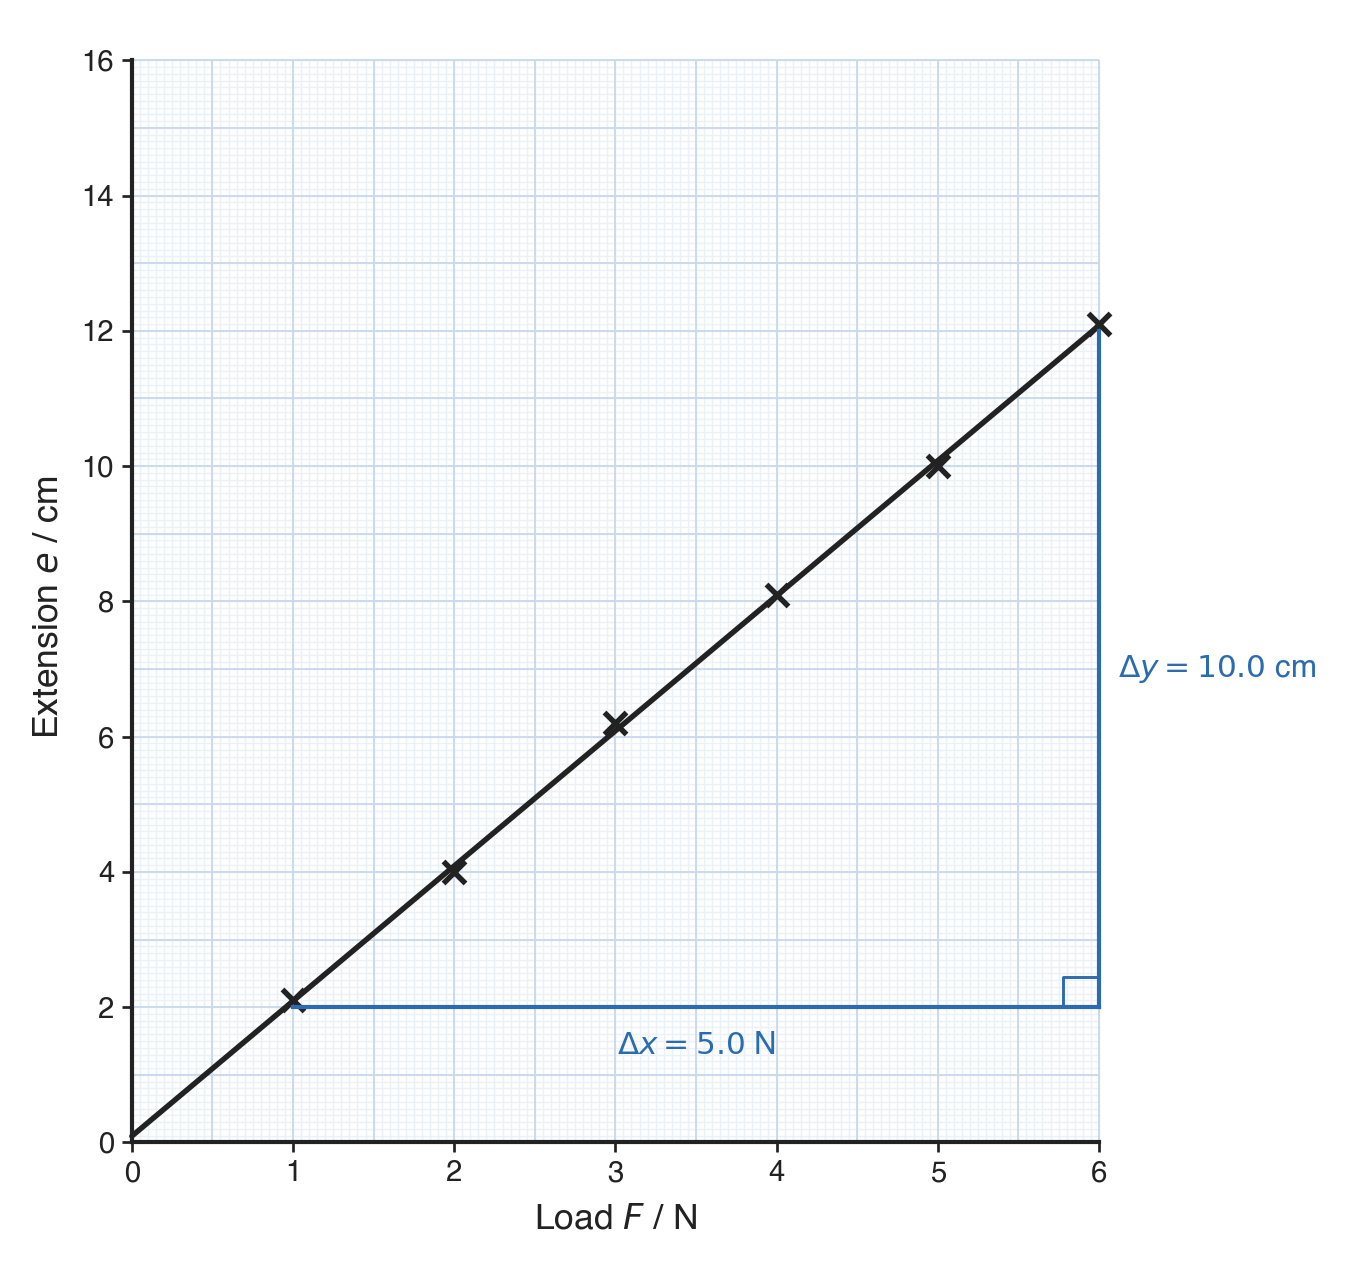
A graph of extension (cm) against load (N) has a line of best fit. Two points chosen on the line are (1.0 N, 2.0 cm) and (6.0 N, 12.0 cm).
Step 1 - Draw the triangle
Draw a horizontal line from (1.0, 2.0) across to , and a vertical line from (6.0, 12.0) down to meet it.
Step 2 - Find
Step 3 - Find
Step 4 - Calculate the gradient
Interpreting the gradient and intercept
Finding the unit of a gradient
The unit of a gradient is always the y-axis unit divided by the x-axis unit.
| Graph | Gradient unit | What the gradient represents |
|---|---|---|
| Extension (cm) against load (N) | cm/N | Extension per unit force |
| Resistance () against length (cm) | Resistance per unit length | |
| Potential difference (V) against current (A) | V/A (or ) | Resistance of the component |
| Distance (m) against time (s) | m/s | Speed |
If a follow-up question asks for a physical quantity, state the calculated gradient with its correct unit.
Reading values from the line
- Interpolation - Reading a value within the range of plotted data. Draw construction lines from one axis to the line of best fit, then across to the other axis.
- Extrapolation - Extending the line of best fit beyond the range of measured data to estimate a value. This is less reliable because the relationship may not continue to hold outside the tested range.
The intercept
- The y-intercept is the point where the line crosses the y-axis (the value of when ).
- A straight line of best fit that passes through the origin (0, 0) shows that the two quantities are directly proportional.
Common exam questions
Question 1
A gradient question is worth 4 marks. What are they for?
Drawing a triangle on the graph; making that triangle cover at least half the line between the outermost plots; showing the calculation as the change in y divided by the change in x; and getting a value inside the accepted range.
Question 2
Why does the question say "show clearly on the graph how you obtained the necessary information"?
Because two of the four marks are for the triangle itself. A correct value with nothing drawn on the graph scores only one mark.
Question 3
Why must the triangle cover at least half the line?
Because a small triangle gives small values for the change in y and the change in x, so the small error in reading each corner off the axes becomes a large fraction of them. A large triangle makes that error much less important.
Question 4
A student takes the coordinates of two of their plotted crosses to work out the gradient. Why is this wrong?
Because the crosses scatter either side of the line of best fit. Two of them give the gradient between two individual readings rather than the gradient of the trend, so the answer can be out even though the arithmetic is right.
Question 5
A graph of resistance in ohms against length in centimetres has a gradient of 0.033. State the unit and say what the gradient represents.
The unit is Ω / cm, and it represents the resistance of one centimetre of the wire.
Question 6
A graph of potential difference against current gives a gradient of 4.05. What quantity is this, and what is its unit?
It is the resistance of the component, 4.05 Ω, because volts divided by amps is ohms.
Question 7
What does it mean if the line of best fit passes through the origin?
That the two quantities are directly proportional: doubling one doubles the other.
Question 8
What is the difference between interpolation and extrapolation?
Interpolation is reading a value from inside the range of your readings, which is reliable because the line is supported by data there. Extrapolation is extending the line beyond the readings and reading from there, which assumes the relationship still holds where you have no evidence.
Question 9
A graph of extension against load has a gradient of 2.0 cm/N. What is the spring constant?
0.5 N/cm, because the spring constant is the load per unit extension, which is one divided by the gradient.