7.9 - Phylogeny
What is phylogeny and why does it matter?
Phylogeny is the study of the evolutionary history and relationships among groups of organisms. It helps scientists understand how different species are related through common ancestry and how life on Earth has diversified over millions of years. By mapping these relationships, phylogeny reveals the unity and diversity of life, a core principle of evolution.
Key purposes of studying phylogeny
- Tracing ancestry - Phylogeny identifies which species share common ancestors, showing how lineages have branched over time.
- Understanding diversity - It explains the vast array of life forms by linking them through evolutionary pathways.
- Predicting traits - Knowledge of evolutionary relationships can help predict characteristics of organisms based on their relatives.
This foundational concept sets the stage for exploring the tools and evidence used to construct evolutionary histories.
Types of evidence for inferring evolutionary relationships
Scientists use a variety of evidence to infer how organisms are related evolutionarily. These pieces of evidence provide clues about shared ancestry and the divergence of lineages over time, forming the basis for constructing models of evolutionary relationships.
Morphological traits
Physical characteristics of organisms, such as bone structure or body shape, are compared to identify similarities and differences. For example, the presence of wings in birds and bats suggests a shared trait, though further analysis is needed to determine if it's due to common ancestry or convergent evolution.
Fossil records
Fossils provide a historical record of organisms, showing traits of extinct species and helping to place them in the timeline of life on Earth. They can indicate when certain traits appeared or disappeared in a lineage.
Molecular data
DNA and protein sequences are analyzed for similarities and differences. Molecular data, such as shared genetic sequences, often provide more accurate and reliable evidence than morphological traits because they are less influenced by environmental adaptations.
Types of molecular data:
- DNA sequences - Comparing specific genes across species can reveal how closely related they are.
- Protein sequences - Similarities in the structure of proteins, like hemoglobin, can indicate shared ancestry.
Molecular evidence tends to be prioritized over morphological traits because it offers a more direct look at genetic relationships, minimizing confusion caused by similar traits evolving independently in unrelated species.
Understanding phylogenetic trees and cladograms
Phylogenetic trees and cladograms are visual tools used to represent evolutionary relationships among organisms. They help scientists hypothesize how species are related and how they have diverged from common ancestors over time. While similar, these diagrams have distinct features and purposes.
Phylogenetic trees
A phylogenetic tree is a branching diagram that shows the evolutionary relationships among species, including the amount of change over time. These trees are often calibrated using fossils or a molecular clock (a method that estimates the rate of genetic mutations over time) to indicate how long ago divergences occurred. They illustrate not only who is related to whom but also the extent of evolutionary divergence between groups.
Cladograms
A cladogram is a diagram that depicts evolutionary relationships among organisms without showing a specific time scale or the degree of evolutionary difference. It focuses purely on the pattern of divergence and shared traits among lineages. Cladograms are used to show which groups are most closely related based on shared characteristics, without quantifying time or change.
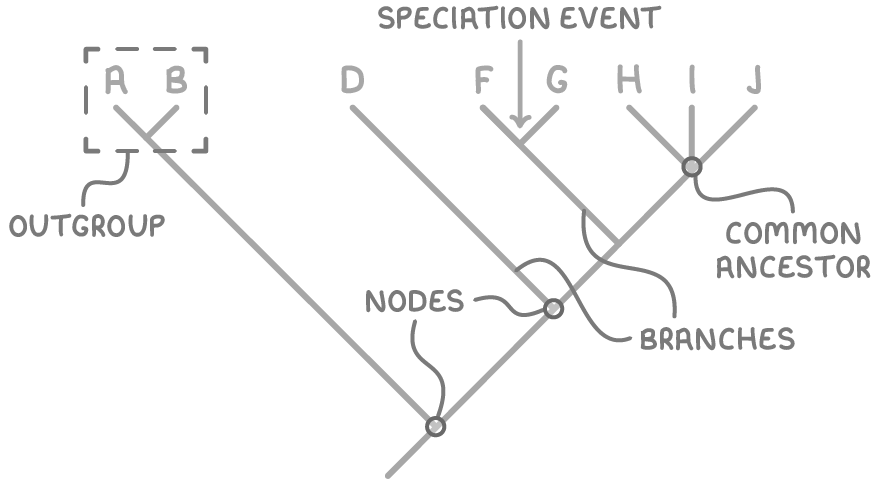
Key components of both diagrams
- Nodes - Points where branches meet, representing the most recent common ancestor of the groups or lineages that diverge from that point.
- Branches - Lines that represent lineages or evolutionary paths leading to different species or groups.
- Out-group - A lineage that is least closely related to the other organisms in the diagram, used as a reference point to determine which traits are shared or derived among the other groups.
These tools provide a visual way to interpret complex evolutionary data, making it easier to see patterns of ancestry and divergence.
Using shared traits to build phylogenetic trees and cladograms
Phylogenetic trees and cladograms are constructed using traits that organisms have gained or lost during evolution. These traits help scientists determine how closely related different species are and where they fit in the evolutionary timeline.
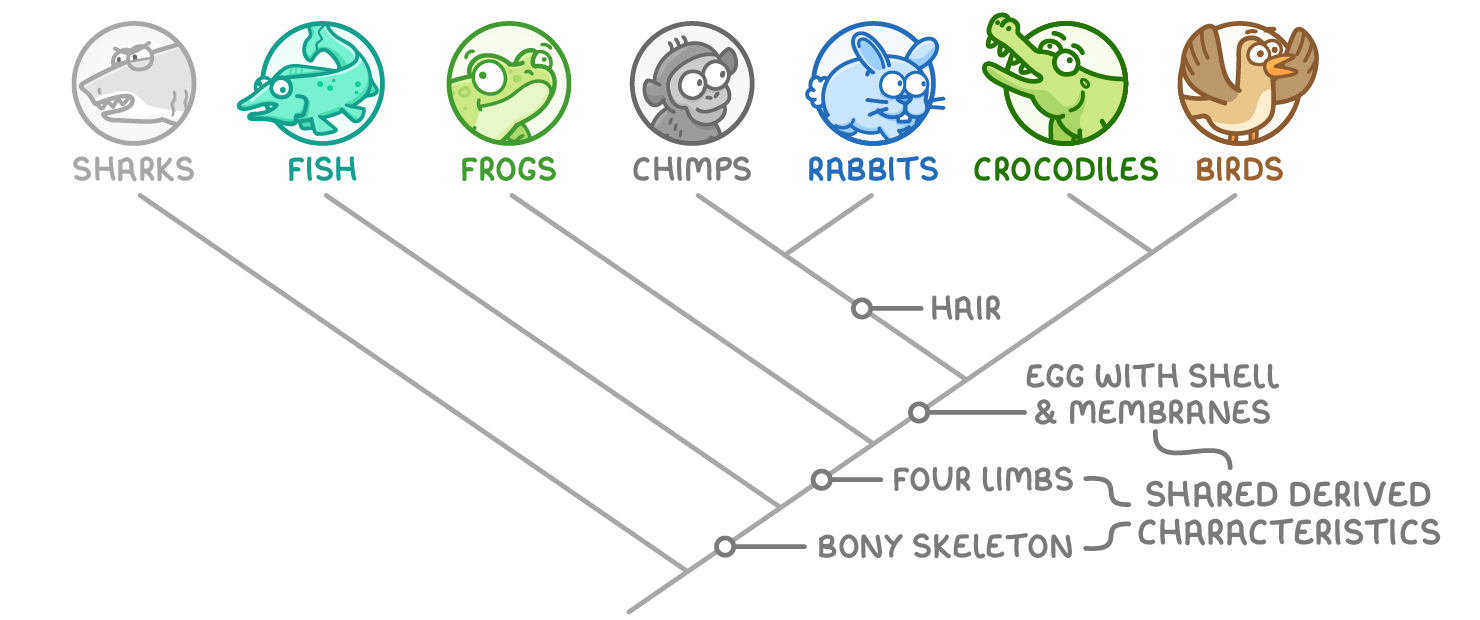
Types of traits used in construction
- Shared derived characters - These are traits that are present in more than one lineage and indicate common ancestry. For instance, the presence of feathers in birds and some dinosaurs suggests they share a common ancestor with this trait. These characters are highly informative for building phylogenetic trees and cladograms.
- Morphological similarities - Comparing physical features of living or fossil species can reveal evolutionary links, though this method can sometimes be misleading due to convergent evolution (unrelated species developing similar traits independently).
- Molecular similarities - DNA and protein sequence data provide a more precise way to identify relationships. For example, a high percentage of shared DNA between humans and chimpanzees indicates a close evolutionary relationship.
By combining these types of evidence, scientists can create detailed diagrams that map out the evolutionary history of life.
Illustrating speciation and common ancestry
Phylogenetic trees and cladograms are powerful tools for showing how speciation, the process by which new species arise, has occurred over time. They help illustrate the branching patterns that result from evolutionary divergence and highlight points of common ancestry.
How speciation is represented
- Branching patterns - Each branch in a phylogenetic tree or cladogram represents a lineage, and the splitting of branches indicates speciation events where one lineage diverges into two or more distinct species.
- Common ancestors at nodes - The nodes where branches split represent the most recent common ancestor shared by the lineages that follow. For example, a node connecting humans and gorillas would represent the ancestor from which both species evolved.
- Visualizing divergence - These diagrams make it clear how groups of organisms have separated over time, leading to the diversity of species we see today.
This visual representation helps clarify how evolutionary processes have shaped the tree of life, connecting all organisms through shared history.
The dynamic nature of phylogenetic hypotheses
Phylogenetic trees and cladograms are not static or final; they are hypotheses about evolutionary relationships that are constantly being tested and revised as new evidence emerges. This dynamic nature reflects the ongoing process of scientific discovery in evolutionary biology.
Why phylogenetic diagrams are revised
- New evidence - Discoveries of new fossils, advancements in molecular sequencing, or reanalysis of existing data can challenge or refine current models of evolutionary relationships.
- Improved techniques - Better technology, such as more precise DNA sequencing methods, can provide clearer insights into relationships that were previously uncertain.
- Reinterpretation of traits - As scientists learn more about the significance of certain traits or molecular markers, they may reclassify organisms or adjust the structure of trees and cladograms.
This adaptability ensures that phylogenetic models remain as accurate as possible, evolving alongside our understanding of life's history.