9.1 - Reaction Rates
- 1Defining reaction rate
- 2Measuring reaction rate
- 3Calculating reaction rate from graphs
Reaction rate
Reaction rate is defined as the change in concentration (or amount) of a reactant or product over time.
A simple formula for finding the rate of a chemical reaction is:
Measuring reaction rates
You can follow the rate of a reaction by measuring either how fast the reactants are used up or how fast the products are formed. Here are three common methods:
- Measuring a decrease in mass
- For reactions that produce gases, you can measure the rate by observing the decrease in mass over time.
- As gas is released, the mass decreases. This method is straightforward but should be conducted in a fume cupboard for safety.
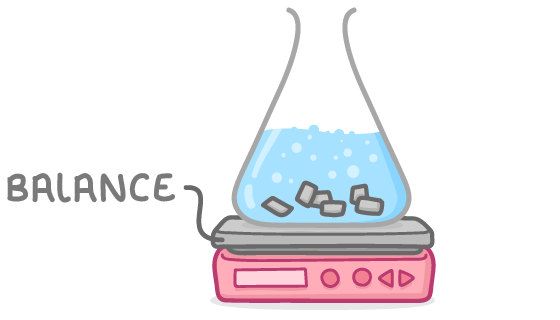
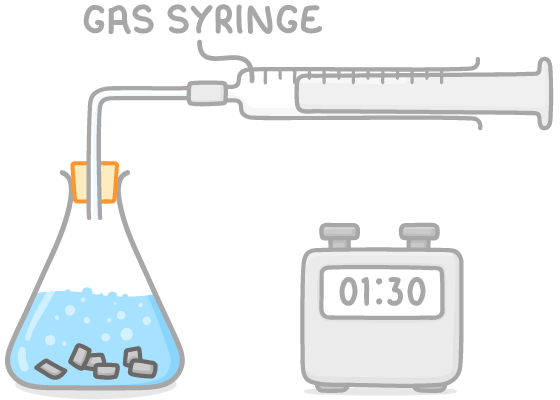
2.** Measuring the volume of gas given off**
- Alternatively, you can use a gas syringe to measure the volume of gas produced over time.
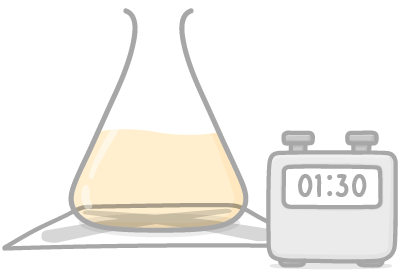
3.** Timing how long a precipitate takes to form**
- This approach is suitable when the product of the reaction is a precipitate.
- Measure how long it takes for a mark to become obscured by the precipitate.
- For consistent comparison of reaction rates, always use the same observer and reference mark.
Calculating rates from graphs
Plotting the amount of reactant used or product formed against time on a graph, the slope (or gradient) of the curve represents the reaction rate.
To calculate the gradient of the graph:
Where:
- y = amount of reactant or product
- x = time
Worked example 1 - Calculating average rate of reaction
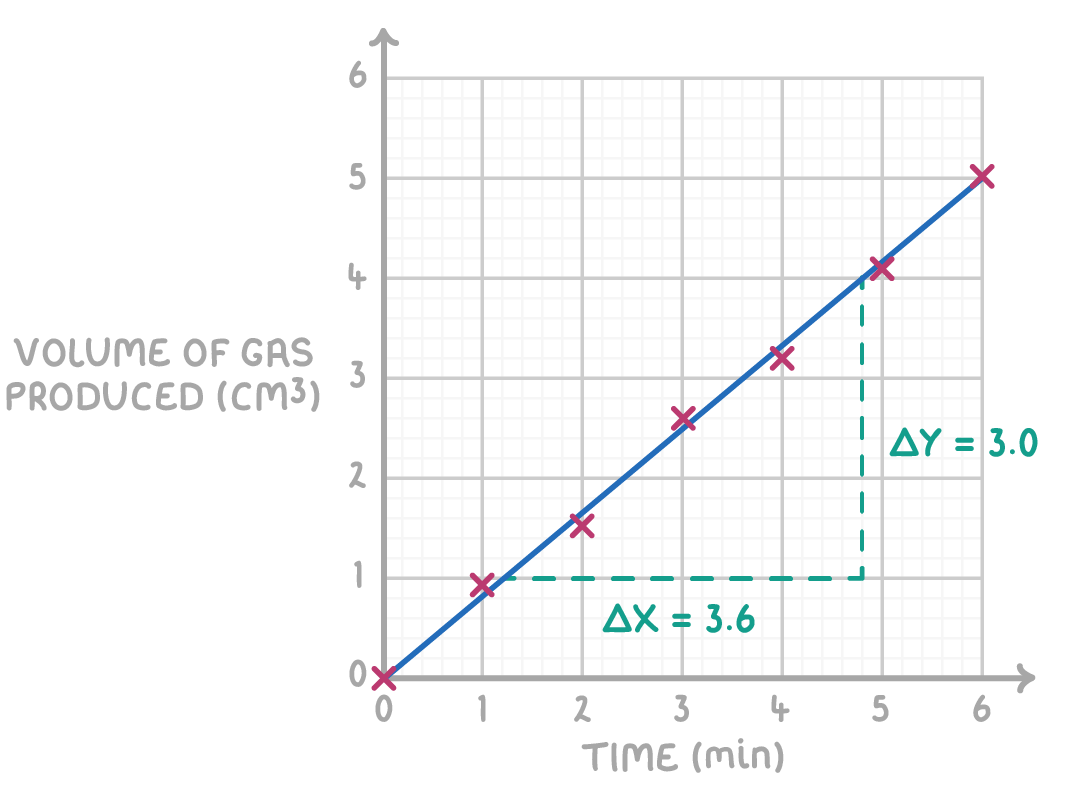
The graph below shows the mass of a reaction vessel measured at regular intervals during a chemical reaction.
Calculate the average rate of reaction, in cm3 min-1.
Step 1: Draw a line of best fit
Draw a line of best fit through the data points, starting from the origin (0,0).
Step 2: Choose two distinct points on the line
Identify and choose two points where the line of best fit intersects a gridline distinctly.
Step 3: Create a triangle
Connect these points using vertical and horizontal lines to form a right-angled triangle.
Step 4: Gradient equation
Step 5: Substitution and correct evaluation
Worked example 2 - Calculating rate of reaction at a specific time
The graph below shows the mass of a reaction vessel measured at regular intervals during a chemical reaction.
Calculate the rate of reaction, in g min-1, at 3 minutes.
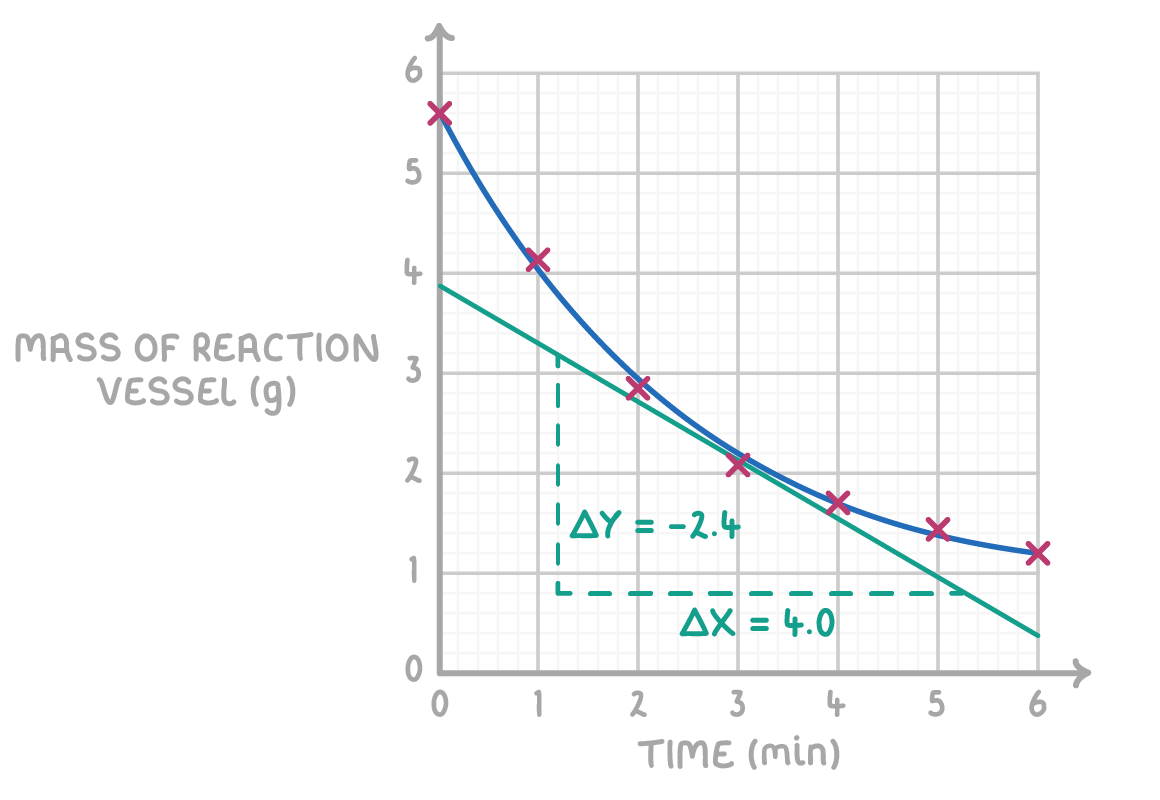
Step 1: Draw a tangent at 3 minutes
Use a ruler to carefully draw a tangent to the curve at the 3 minute mark on the graph. Extend the tangent across the graph.
Step 2: Choose two distinct points on the tangent
Identify and choose two points where the tangent intersects a gridline distinctly.
Step 3: Create a triangle
Connect these points using vertical and horizontal lines to form a right-angled triangle.
Step 4: Gradient equation
Step 5: Substitution and correct evaluation