2.8 - Determinants of PED
Factors influencing price elasticity of demand
Price elasticity of demand (PED) measures how much the quantity demanded of a good or service changes in response to a change in its price.
Availability and similarity of substitutes
The presence of alternatives significantly affects PED:
- High number of close substitutes - Leads to elastic demand; a price increase causes a large drop in quantity demanded.
- Few or no close substitutes - Results in inelastic demand; quantity demanded falls only slightly with a price rise.
- Broader vs narrower definitions - Wider categories have fewer substitutes and more inelastic demand, while specific items have more substitutes and elastic demand.
- Closeness matters - A herbal infusion is a closer substitute for tea than a fizzy drink is for coffee.
Characteristics of the good
The type of product influences how responsive demand is to price changes:
- Necessities - Demand is typically inelastic because consumers continue buying regardless of price.
- Addictive or habit-forming goods - These have inelastic demand as it's hard for users to cut back.
Proportion of income allocated to the good
The share of a consumer's budget spent on a product affects PED:
- Low proportion of income - Demand is inelastic; price hikes have little impact.
- High proportion of income - Demand becomes elastic; consumers react strongly to price changes.
- Income level variations - For low-income individuals, everyday items represent a larger budget share, making demand more elastic.
Duration of the time period
Time allows consumers to adapt, altering PED:
- Short-term effects - Demand is inelastic as habits and alternatives are hard to change quickly.
- Long-term effects - Demand becomes elastic as people find substitutes or modify behaviour.
The relationship between PED and total revenue
Total revenue is the income a business earns from selling goods or services
Formula for total revenue:
Where:
- Total revenue (TR) = Overall income from sales (£)
- Price (P) = Selling price per unit (£)
- Quantity demanded (Q) = Number of units sold
Note that total revenue differs from profit, which subtracts costs from revenue.
Effects of price increases on revenue
Price rises impact revenue differently depending on PED:
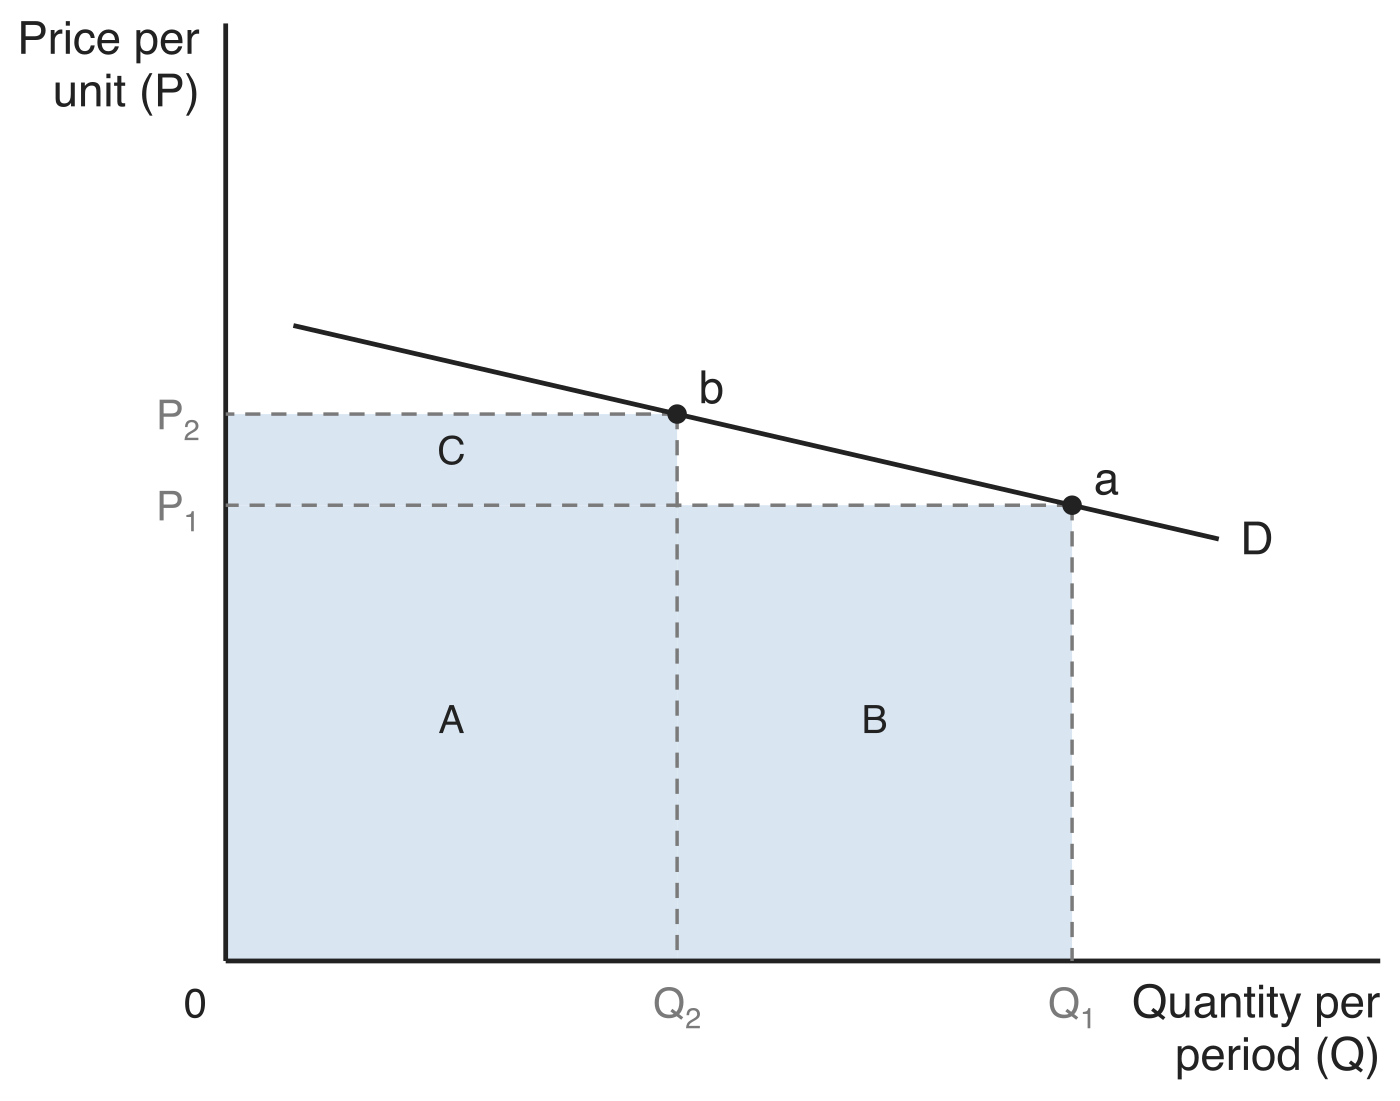
- Elastic demand (PED > 1) - Quantity demanded falls more than the price rises, reducing total revenue.
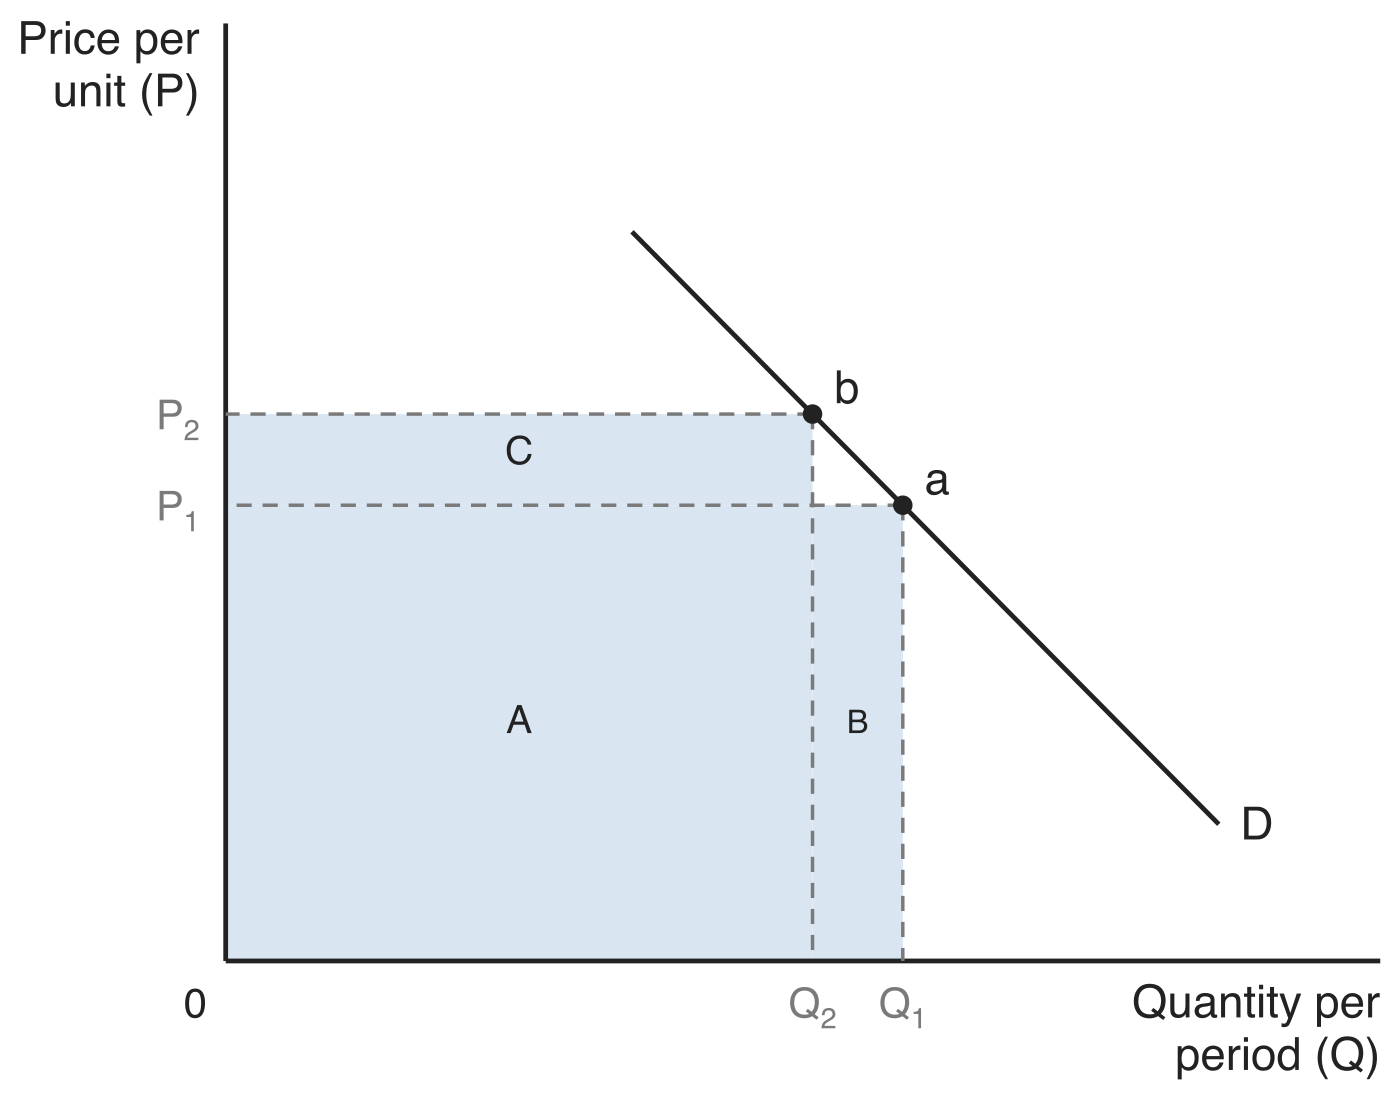
- Inelastic demand (0 < PED < 1) - Quantity demanded falls less than the price rises, increasing total revenue.
- Unit elastic demand (PED = 1) - The fall in quantity demanded matches the price rise, leaving total revenue unchanged.
Total revenue is the rectangle formed by the price per unit (P) and the quantity per period (Q) at a point on the demand curve, so a price rise trades one block of revenue for another. In the diagram below, demand is price elastic between the two points. At point a the price is P1 and the quantity demanded is Q1, so total revenue is areas A plus B. Raising the price to P2 moves the market up the demand curve D to point b, where quantity demanded falls to Q2 and total revenue becomes areas A plus C. Area B is the revenue lost and area C is the revenue gained, and because the loss B is larger than the gain C, total revenue falls.
In the diagram below demand is price inelastic between points a and b, so the same rise from P1 to P2 along the demand curve D cuts quantity demanded only from Q1 to Q2. Area A is unchanged, the lost area B is a narrow strip only as wide as the small quantity lost, while the gained area C is shorter but stretches across the full quantity Q2, so the gain outweighs the loss and total revenue rises.
Effects of price decreases on revenue
Price cuts also vary in their revenue outcomes based on PED:
- Elastic demand (PED > 1) - Quantity demanded rises more than the price falls, boosting total revenue.
- Inelastic demand (0 < PED < 1) - Quantity demanded rises less than the price falls, decreasing total revenue.
- Unit elastic demand (PED = 1) - The rise in quantity demanded matches the price fall, keeping total revenue the same.
Key patterns in PED and revenue maximisation
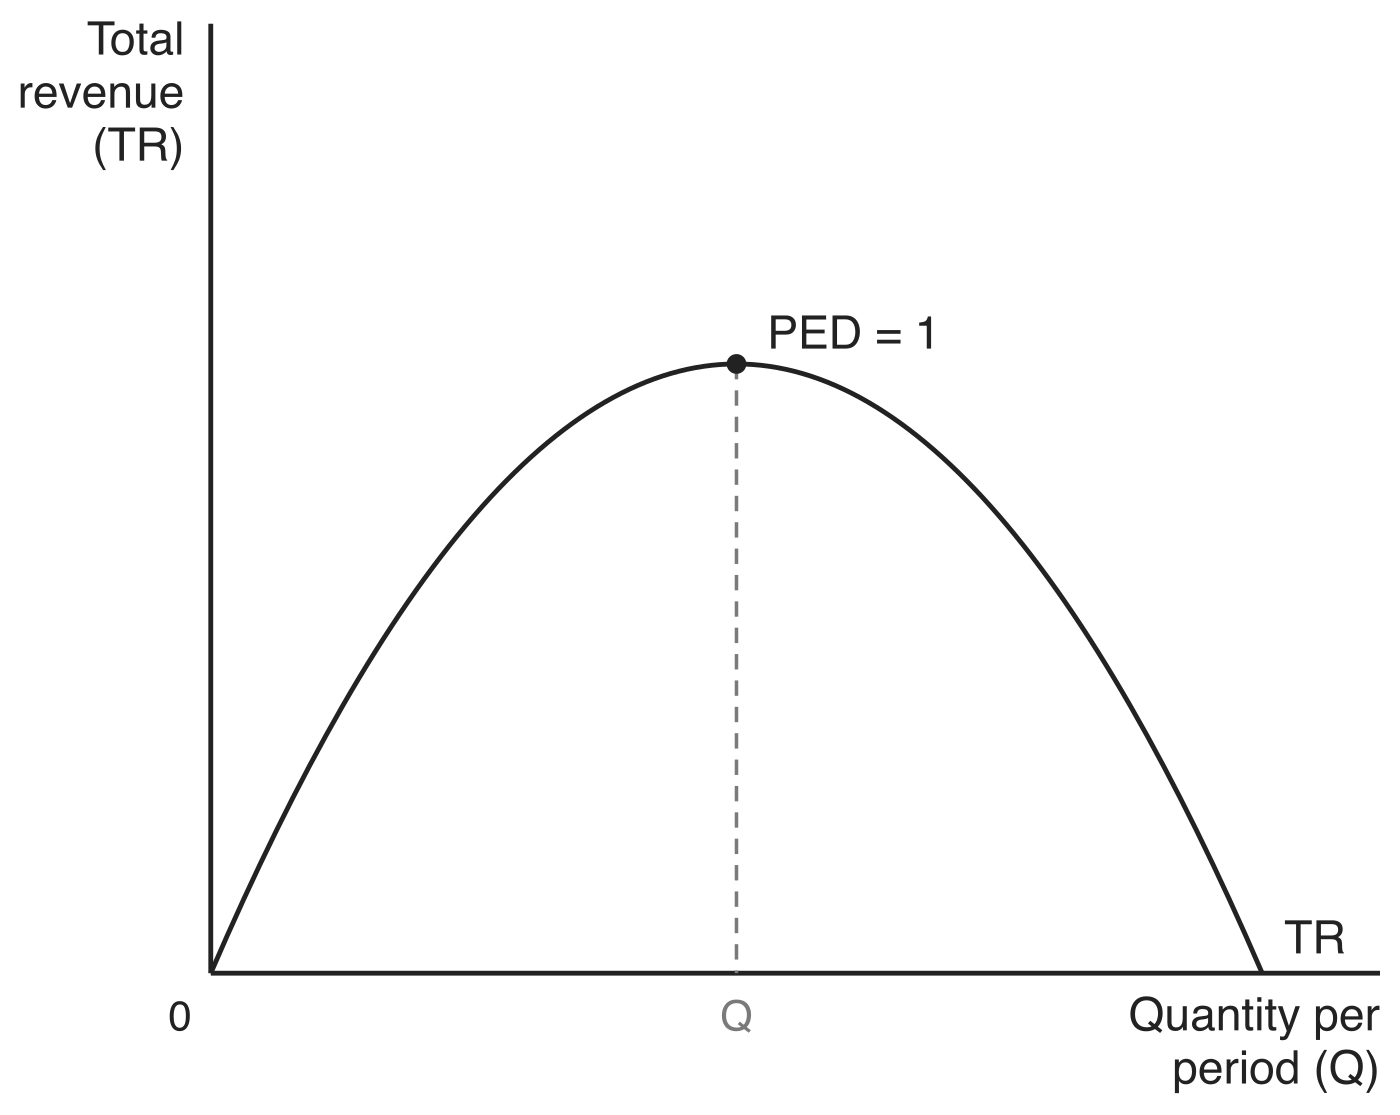
The two cases combine into one pattern: when demand is price elastic, total revenue moves in the same direction as quantity demanded, and when demand is price inelastic it moves in the same direction as price.
| PED | If price rises | If price falls |
|---|---|---|
| Price elastic (PED > 1) | Quantity demanded falls proportionately more, so total revenue falls | Quantity demanded rises proportionately more, so total revenue rises |
| Price inelastic (0 < PED < 1) | Quantity demanded falls proportionately less, so total revenue rises | Quantity demanded rises proportionately less, so total revenue falls |
| Unit elastic (PED = 1) | Quantity demanded falls in the same proportion, so total revenue is unchanged | Quantity demanded rises in the same proportion, so total revenue is unchanged |
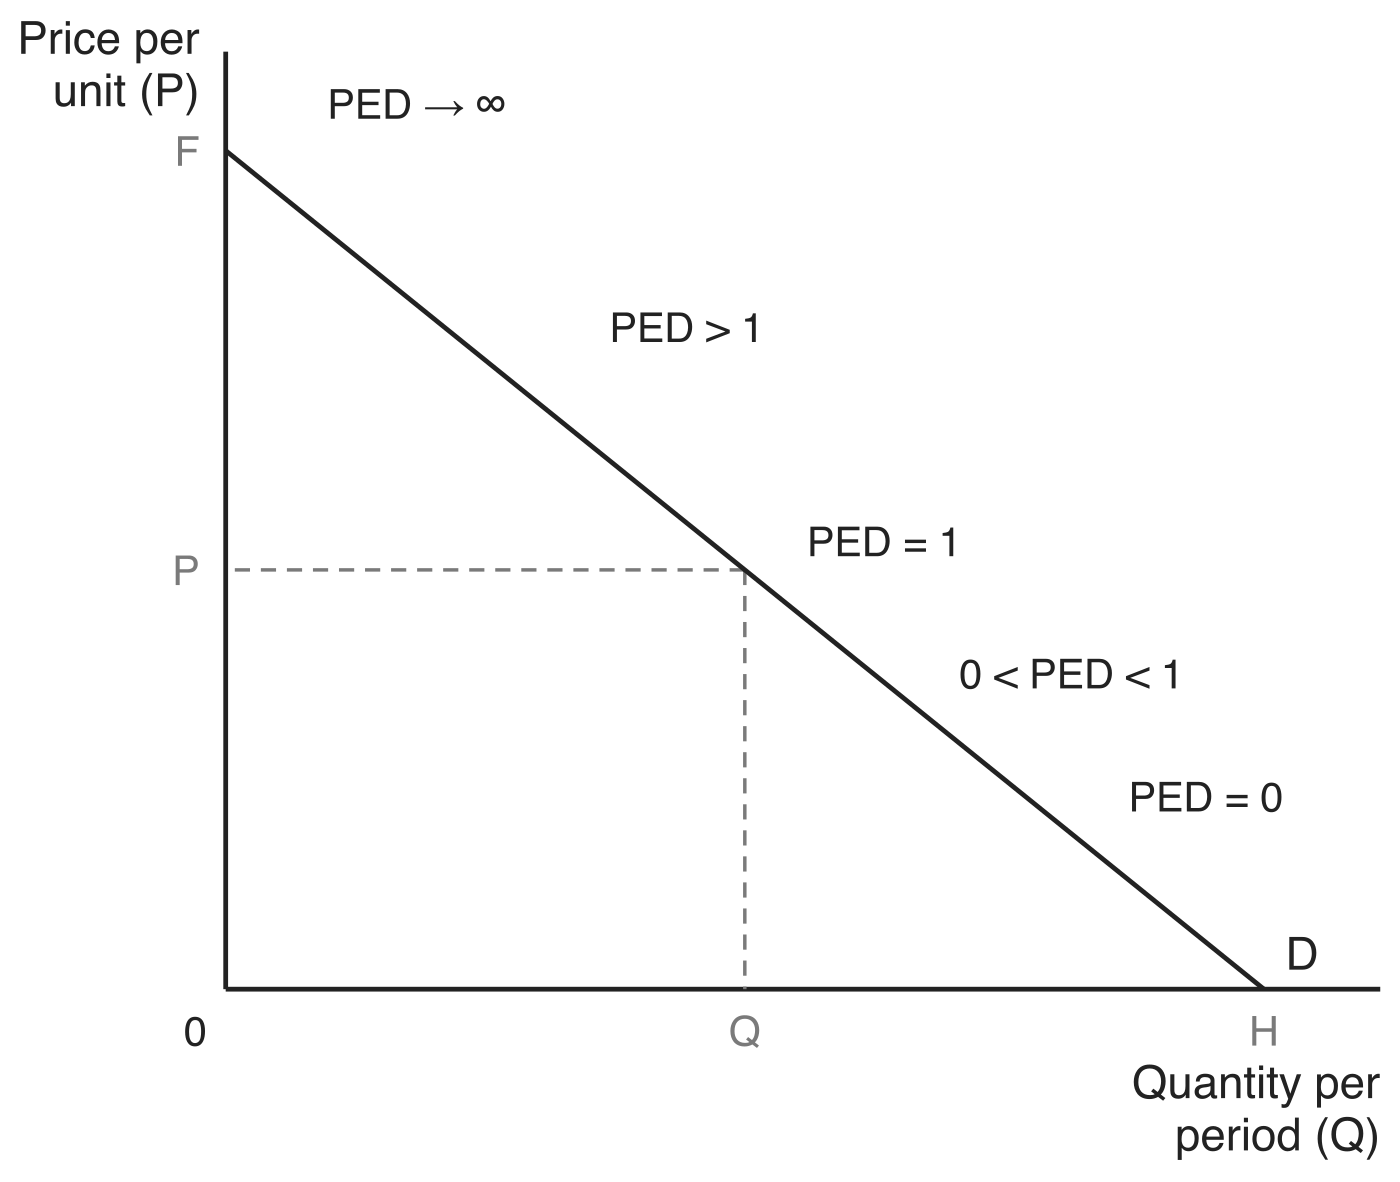
On a straight-line demand curve, PED falls steadily as you move down the curve, so total revenue peaks at the midpoint where PED equals 1. The diagram below marks the ranges along the demand curve D, with the price per unit (P) on the vertical axis and the quantity per period (Q) on the horizontal axis. Demand is perfectly elastic at the price F, where PED → ∞; it is price elastic (PED > 1) above the midpoint; PED = 1 at the midpoint, where the price is P and the quantity demanded is Q; demand is price inelastic (0 < PED < 1) below the midpoint; and PED = 0 at H, where the price has fallen to zero.
The diagram below plots total revenue (TR) against the same quantity axis. As the price falls and quantity demanded rises through the elastic range, TR rises from zero, because quantity rises proportionately more than the price falls. Past the midpoint demand is price inelastic, so quantity rises proportionately less than the price falls and TR falls back to zero. TR is therefore at a maximum at the quantity Q, where PED = 1.