17.3 - Activation Energy
- 1
What activation energy is
- 2
Energy profiles for exothermic and endothermic reactions
- 3
Maxwell-Boltzmann energy distribution curves
- 4
How temperature affects the distribution of kinetic energies
Activation energy is the minimum kinetic energy needed for a reaction
The activation energy, Ea, is defined as the minimum kinetic energy, Ek, that colliding particles must possess for a reaction to occur.
- If the total kinetic energy of the colliding particles is less than the activation energy (Ek < Ea), the collision will not result in a reaction, regardless of particle orientation.
- If the kinetic energy is greater than or equal to the activation energy (Ek ≥ Ea), the collision can lead to a reaction if the particles are correctly oriented.
A simple analogy for activation energy involves a ball at the bottom of a hill. The ball needs to be pushed up the hill (requiring an input of energy) before it can roll down the other side to a lower point.
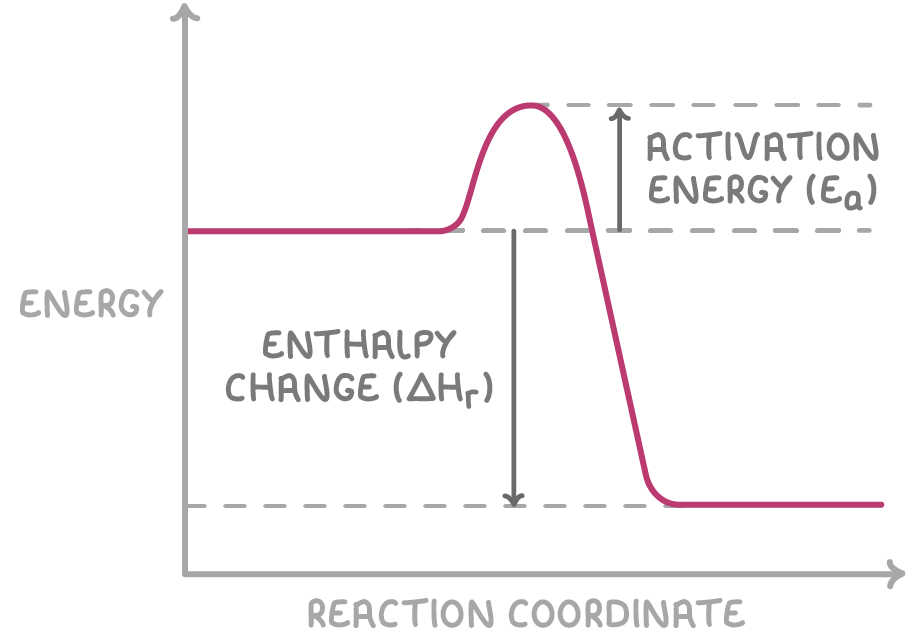
In this case:
- The height of the hill represents the activation energy (Ea).
- The difference in height between the ball's starting and ending positions represents the enthalpy change of the reaction (ΔHr).
Energy profile diagrams visualise reaction progress and activation energy
The progress of a chemical reaction can be visualised using an energy profile diagram:
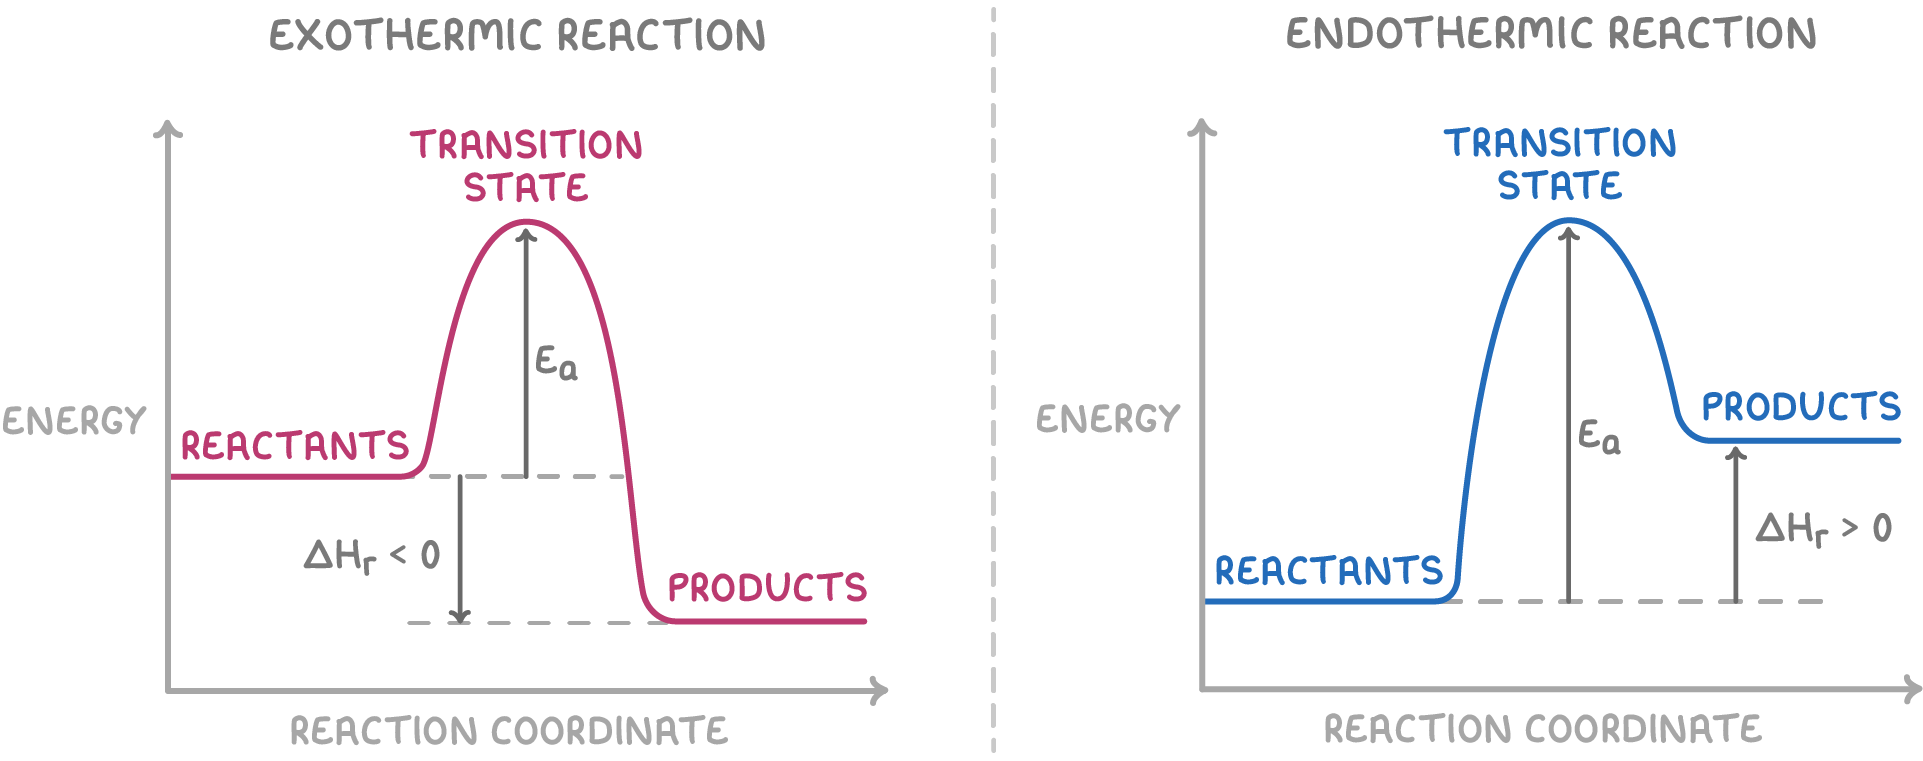
Key features of the energy profile diagram:
- The y-axis shows the energy and the x-axis shows the reaction coordinate (progress of the reaction from reactants to products).
- The 'transition state' is the highest energy point - it represents the point where bonds are in the process of breaking and forming.
- The activation energy (Ea) is the difference in energy between the reactants and the transition state.
- In an exothermic reaction (ΔHr < 0), the products have lower energy than the reactants.
- In an endothermic reaction (ΔHr > 0), the products have higher energy than the reactants.
Maxwell-Boltzmann distribution curves show the spread of particle kinetic energies
The Maxwell-Boltzmann distribution shows the spread of kinetic energies for particles at a given temperature.
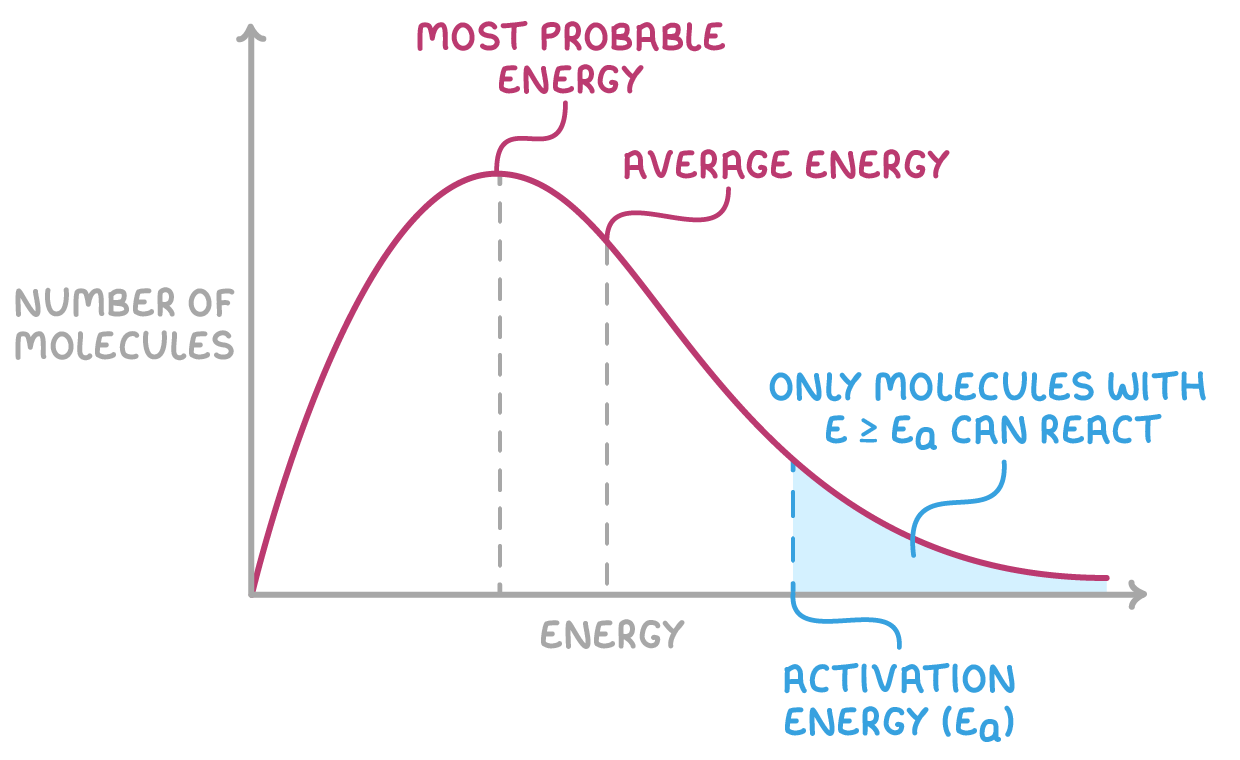
The Maxwell-Boltzmann distribution curve is characterised by several key features:
- The curve originates at the origin, indicating that no molecules have zero kinetic energy.
- It rises sharply to a peak that represents the most probable kinetic energy a single molecule can have.
- The total area under the curve represents the total number of molecules.
- The average energy of molecules is a bit higher than the most probable energy.
- The area under the curve to the right of Ea shows the proportion of particles with enough energy to react if they collide (Ek > Ea).
Effect of temperature on Maxwell-Boltzmann curves
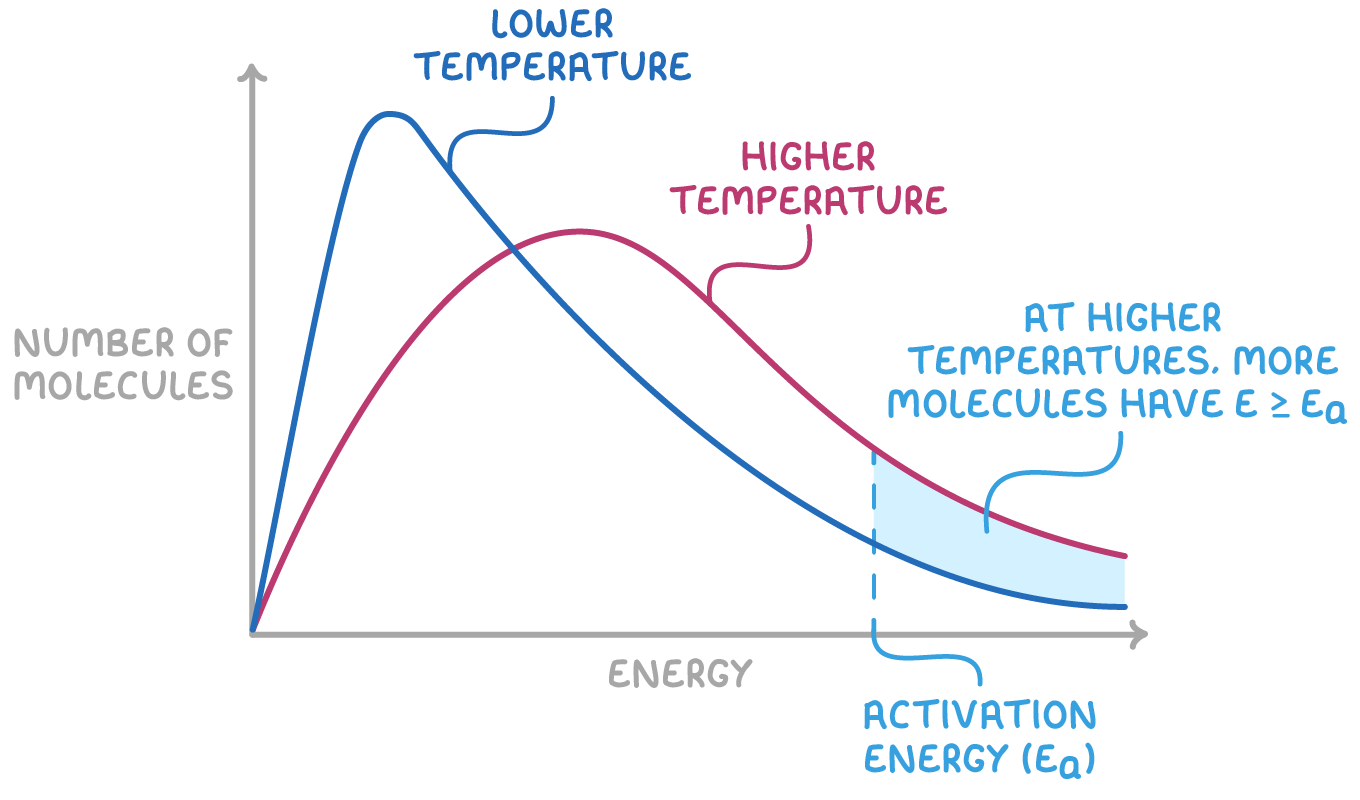
When the temperature increases, it affects the kinetic energy distribution:
- At a lower temperature, the curve is tall and narrow with the peak at a lower Ek value.
- At a higher temperature, the curve is shorter and broader with the peak shifted to a higher Ek value.
- The area under the curve to the right of Ea is larger at higher temperatures - this means a greater proportion of particles have Ek > Ea.
- As a result, at higher temperatures, a larger fraction of collisions have enough energy to overcome the activation energy barrier. This leads to an increase in the overall reaction rate.
Although Maxwell–Boltzmann distributions are specific to gases, the general relationship between temperature and reaction rate applies to all states of matter.
For most reactions at moderate temperatures (0–100°C), the rate increases by a factor of two to four for every 10°C rise in temperature.