19.5 - pH Curves for Strong & Weak Acids & Bases
- 1
What a pH curve is and how it's produced
- 2
The shapes of pH curves for different types of acid-base titrations
- 3
Using half-equivalence points to determine pKa and pKb values
- 4
How acid-base indicators work
- 5
Selecting appropriate indicators for titrations
Generating pH curves through titration
A pH curve is a graphical representation of how the pH of a solution changes during an acid-base titration. It is obtained by plotting the pH of the reaction mixture against the volume of the standard solution (titrant) added.
To generate a pH curve:
- The unknown concentration of an acid or base (analyte) is determined by titration with a standard solution of a base or acid (titrant).
- The pH of the reaction mixture is continuously monitored using a digital pH meter and a data logger as the titrant is gradually added.
- The collected pH data is then plotted against the volume of the titrant, producing the pH curve.
The shape of the resulting pH curve depends on the strengths and concentrations of the analyte and titrant, as well as the order in which they are added.
Strong acid + strong base titrations
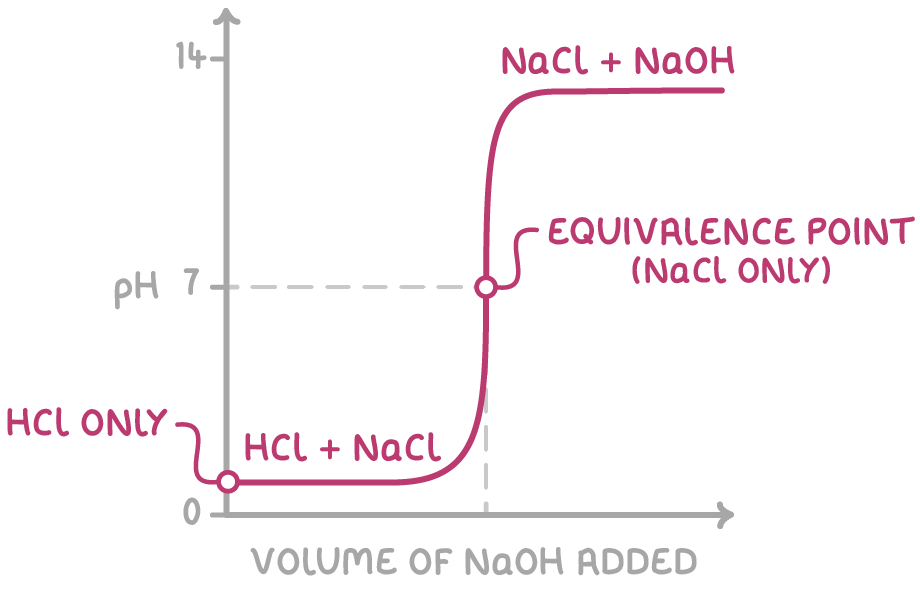
When a strong acid, like hydrochloric acid (HCl), is titrated with a strong base, such as sodium hydroxide (NaOH), the pH curve has a characteristic shape:
- Low initial pH - The initial pH is low (typically between 0-2) as the HCl(aq) analyte is strongly acidic.
- Gradual pH rise before equivalence - The pH rises slowly at first due to the large excess of acid present. The curve becomes progressively steeper as [HCl] decreases.
- Sharp pH rise at the equivalence point - At this point, the acid is completely neutralised by the base (the number of moles of H+ and OH- are stoichiometrically equivalent).
- Equivalence point at pH 7 - The reaction mixture contains only NaCl(aq) as a product. NaCl is a neutral salt that does not undergo hydrolysis. Neither the Na+ nor the Cl- ions react with water to produce H+ or OH- ions so the resulting solution has a pH of 7.
- High final pH - The curve flattens out as the NaOH(aq) excess becomes very large. The final pH is that of the NaOH(aq) titrant (usually pH 12-14).
Strong base + strong acid titrations
The pH curve for a strong base-strong acid titration has an inverted shape compared to a strong acid-strong base titration, but equivalence still occurs at pH 7.0.
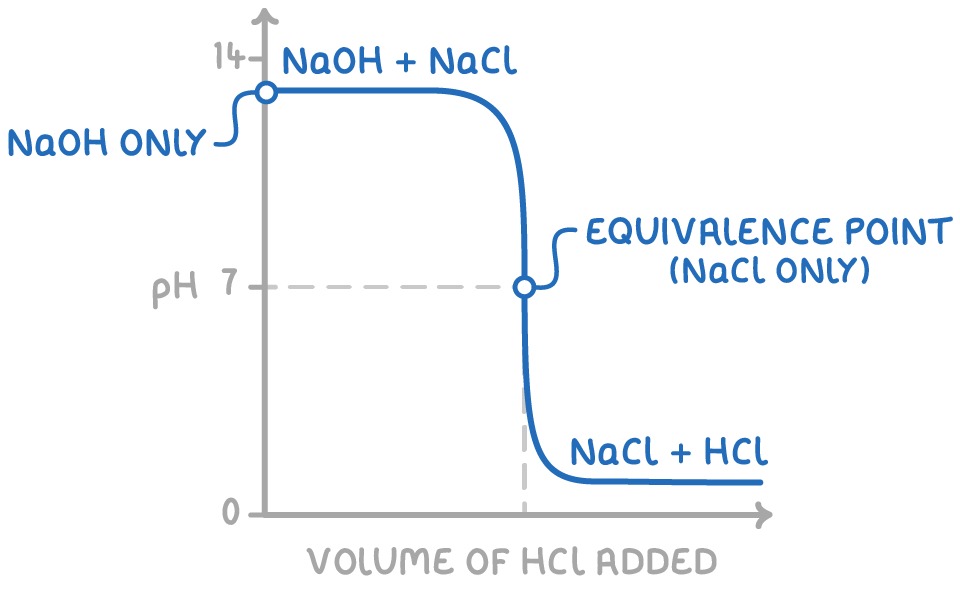
The key difference is that in a strong base-strong acid titration, the initial pH is high (12-14) due to the strong base, and the final pH is low (0-2) due to the excess strong acid.
Weak acid + strong base titrations
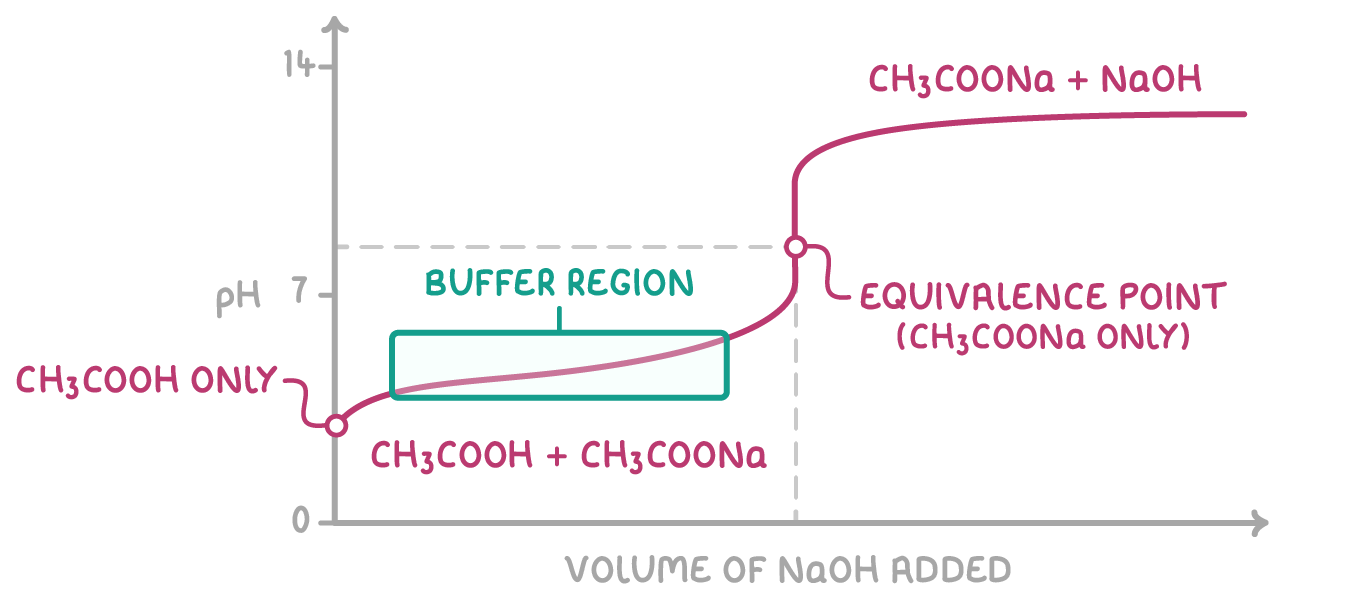
When a weak acid, such as ethanoic acid (CH3COOH), is titrated with a strong base, like sodium hydroxide (NaOH), the resulting pH curve differs from that of a strong acid-strong base titration in the following ways:
- Starts at a higher pH than strong acids - Weak acids only partially dissociate, resulting in a lower [H+] compared to strong acids.
- Has a buffer region before the equivalence point - In this region, CH3COOH and its conjugate base (CH3COO-) work together to resist changes in pH.
- Smaller pH jump at equivalence - The jump is less pronounced because the weak acid doesn't fully dissociate, so there are fewer H+ ions to neutralise.
- Equivalence point above pH 7 - The anion of the salt CH3COONa undergoes hydrolysis, reacting with water to form excess OH- ions, which makes the solution slightly alkaline at the equivalence point.
CH3COO-(aq) + H2O(l) ⇌ CH3COOH(aq) + OH-(aq)
After the equivalence point, the pH curves for both strong and weak acids with strong bases flatten out at a high pH (around 12-14) due to the excess of strong NaOH(aq).
pKa equals pH at the half-equivalence point
At the half-equivalence point of a weak acid-strong base titration, exactly half of the weak acid has been neutralised. The pH at this point is equal to the pKa of the weak acid.
For example, consider the dissociation of ethanoic acid (CH3COOH):
CH3COOH(aq) ⇌ CH3COO-(aq) + H+(aq)
$K_{a }=\frac{[CH_{3}COO^{-}][H^{+}]}{[CH_{3}COOH]}$
At the half-equivalence point, [CH3COOH] = [CH3COO-]. Substituting this into the Ka expression:
Ka = [H+]
Taking the negative logarithm of both sides:
pKa = pH
Therefore, at the half-equivalence point, the pKa of the weak acid is equal to the pH of the solution.
Weak base + strong acid titrations
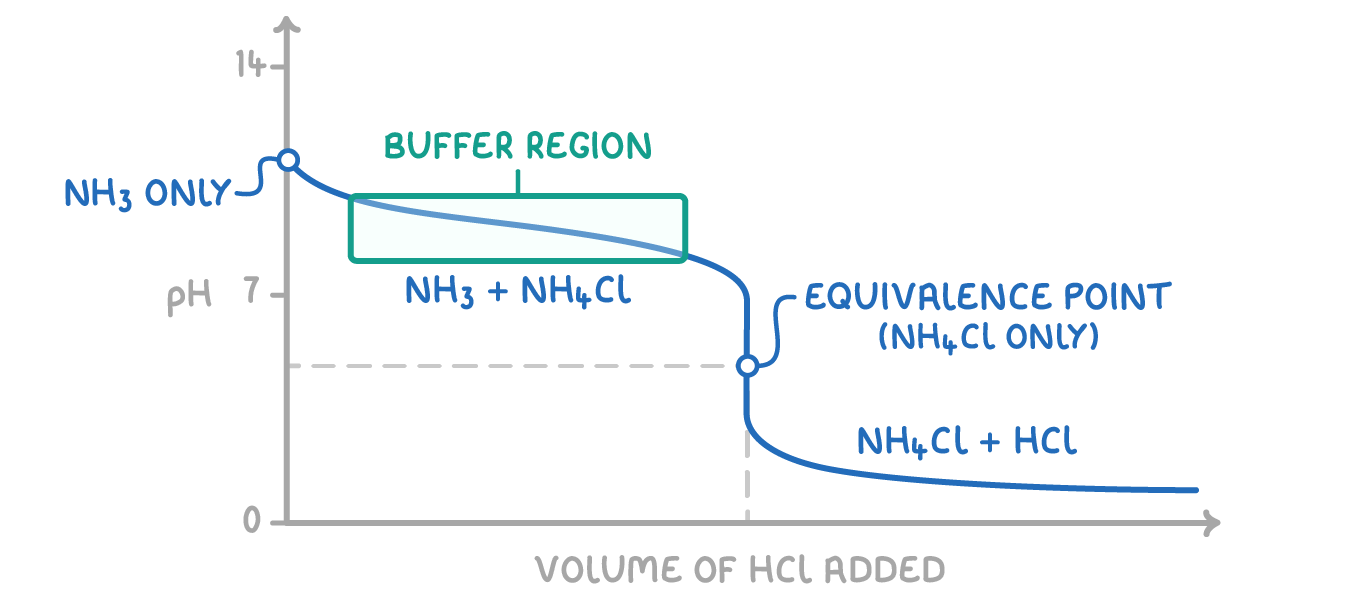
When a weak base like ammonia (NH3) is titrated with a strong acid like HCl, the pH curve is nearly the mirror image of the weak acid + strong base case, with the following characteristics:
- Starts around pH 10 - NH4OH only partially dissociates, resulting in a lower [OH-] compared to strong bases.
- Has a buffer region before the equivalence point - In this region, NH3 and its conjugate acid (NH4+) work together to resist changes in pH.
- Small drop in pH at equivalence - The weak base doesn't fully dissociate, so there are fewer OH- ions to neutralise.
- Equivalence point below pH 7 - The cation of the salt NH4Cl undergoes hydrolysis, reacting with water to form excess H3O+ ions, which makes the solution slightly acidic at the equivalence point.
NH4+(aq) + H2O(l) ⇌ NH3(aq) + H3O+(aq)
- Ends around pH 1 - The low pH at the end is caused by the excess HCl(aq) after the equivalence point.
pKb equals pOH at the half-equivalence point
At the half-equivalence point of a weak base-strong acid titration, exactly half of the weak base has been neutralised. The pOH at this point is equal to the pKb of the weak base.
For example, consider the equilibrium of ammonia and water:
NH3(aq) + H2O(l) ⇌ NH4+(aq) + OH-(aq)
$K_{b }=\frac{[NH_{4}^{+}][OH^{-}]}{[NH_{3}]}$
At the half-equivalence point, [NH4+] = [NH3]. Substituting this into the Kb expression:
Kb = [OH-]
Taking the negative logarithm of both sides:
pKb = pOH
Therefore, at the half-equivalence point, the pKb of the weak acid is equal to the pOH of the solution.
Weak acid + weak base titrations
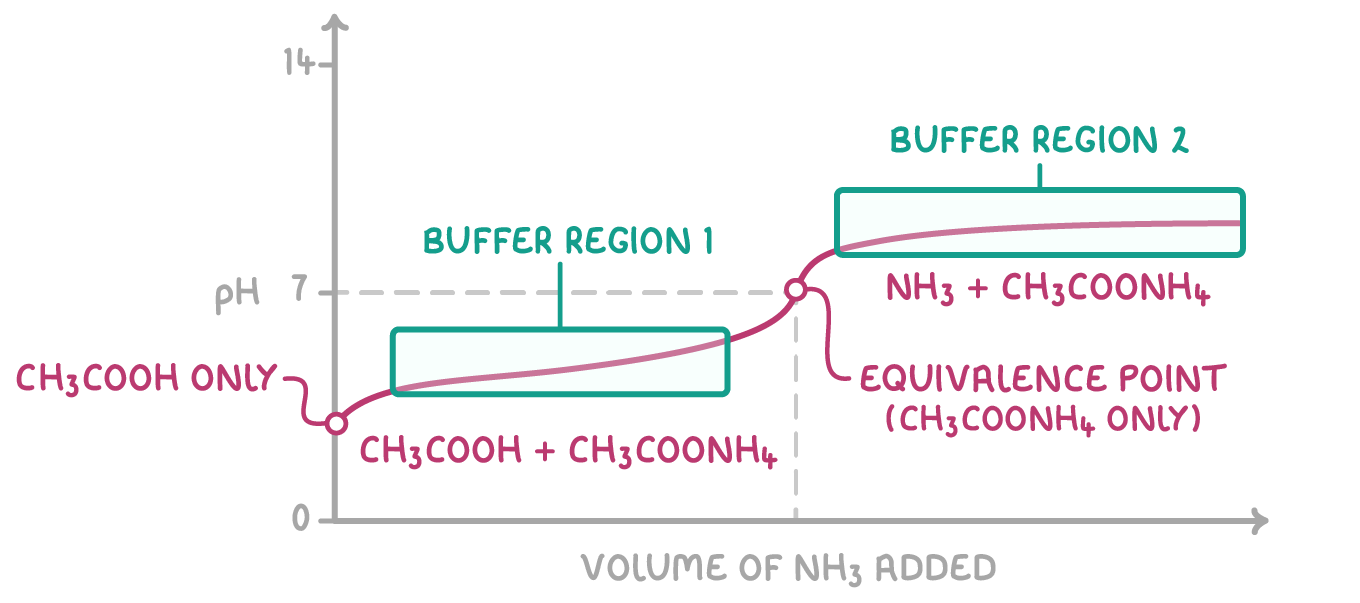
In titrations involving both a weak acid and a weak base, such as CH3COOH and NH3, the pH curve exhibits following characteristics:
- Starts around pH 3 - CH3COOH partially dissociates.
- Two buffer regions - The first buffer region occurs before the equivalence point and is created by CH3COOH and its conjugate base (CH3OO-). The second buffer region occurs after the equivalence point and is formed by NH3 and its conjugate acid (NH4+).
- No sharp pH changes - The pH changes gradually throughout the titration because both CH3COOH and NH4OH only partially dissociate, releasing H+ and OH- ions slowly.
- Equivalence point near pH 7 - The exact pH at the equivalence point depends on the relative strengths (Ka and Kb values) of the weak acid and weak base.
- Ends around pH 9 - NH4OH partially dissociates.
These titrations are rarely performed in practice because the gradual pH changes make it difficult to accurately determine the end point.
Acid-base indicators
Acid-base indicators are weak acids (HInd) or weak bases that change colour when they dissociate according to the equation:
HInd(aq) ⇌ H+(aq) + Ind-(aq)
The colour change occurs over a specific pH range, typically pKa ± 1, known as the transition range. The colour change in indicators occurs because they have differently coloured conjugate acid-base pairs.
Consider the equilibrium for the acid-base indicator methyl orange:
Methyl orange-H ⇌ methyl orange- + H+
(red) (yellow)
Upon addition of a basic solution containing OH- ions:
- OH- ions from the base react with H+ ions in the methyl orange indicator.
- The position of equilibrium shifts to the right.
- The colour of the solution changes to yellow, the colour of methyl orange-.
Upon addition of an acidic solution containing H+ ions:
- H+ ions from the acid react with methyl orange- ions from the indicator.
- The position of equilibrium shifts to the left.
- The colour of the solution changes to red, the colour of methyl orange-H.
At the end point of a titration, the indicator changes colour, signaling the completion of the titration. For accurate results, the end point should be as close as possible to the equivalence point. When using methyl orange as the indicator, the solution at the end point contains equal concentrations of red methyl orange-H and yellow methyl orange-, resulting in an orange colour.
Selecting indicators for titrations
To choose the most suitable indicator for a titration, select one whose transition range includes the pH at the titration's equivalence point. The type of acid and base being titrated determines the appropriate indicator.
The following table summarises the properties and suitable titrations for some common indicators:
| Indicator | pK_a_ | pH range | Colour in acid | Colour in alkali |
|---|---|---|---|---|
| Methyl orange | 3.7 | 3.1-4.4 | Red | Yellow |
| Bromothymol blue | 7.0 | 6.0-7.6 | Yellow | Blue |
| Phenolphthalein | 9.6 | 8.3-10.0 | Colourless | Pink |
- Strong acid + strong base titrations - Any common indicator can be used because of the large pH change at the equivalence point. Bromothymol blue is the best choice, as its transition range is closest to the equivalence point at pH 7.
- Weak acid + strong base titrations - Phenolphthalein or bromothymol blue are appropriate since the equivalence point is above pH 7. Methyl orange changes colour too early and is not suitable.
- Weak base + strong acid titrations - Methyl orange is the best options because the equivalence point is below pH 7. Phenolphthalein changes colour too late and is not suitable.
- Weak acid + weak base titrations - Indicators are not useful because the gradual pH change makes it difficult to detect the end point visually. Instead, a pH meter should be used to accurately determine the equivalence point.