7.5 - Reading & Interpreting Graphs
What a graph-reading question looks like
Graph questions typically ask you to do three things:
- Read a value off the line - Showing dashed construction lines on the graph to show where the value came from.
- Describe the trend - Stating the direction of the relationship, backed up with figures from the axes.
- Calculate a gradient - Drawing a large triangle on the line of best fit and dividing the change in by the change in .
A typical question
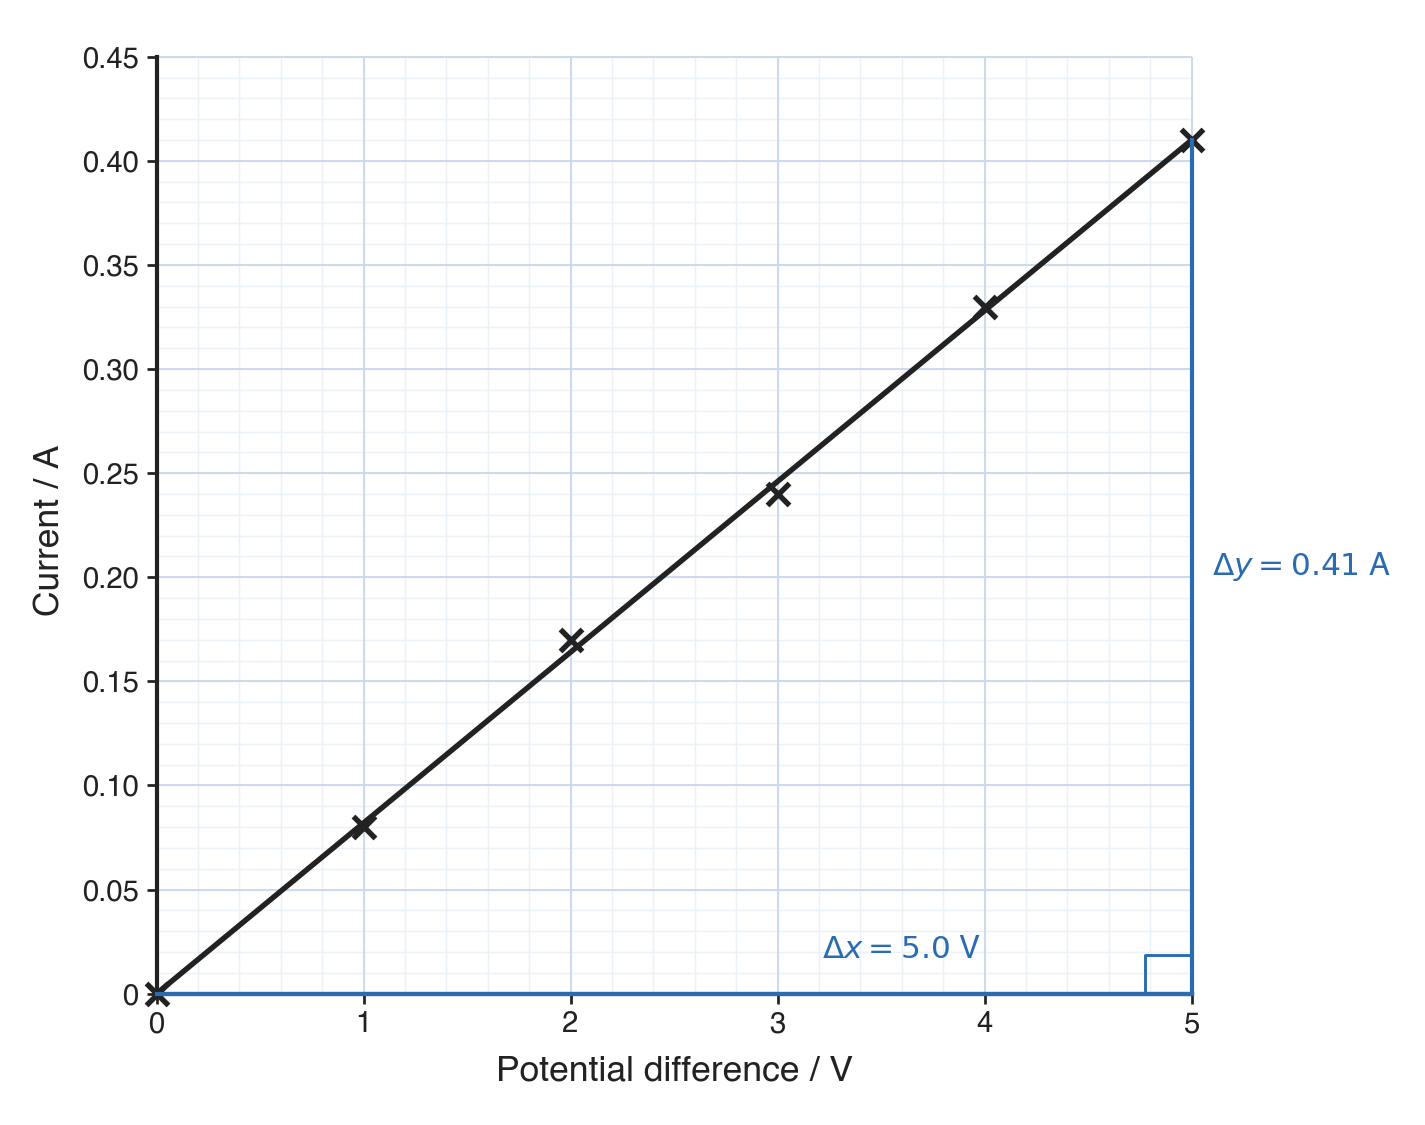
The graph shows how the current through a resistor changes with the potential difference across it.
(a) Use the graph to determine the current when the potential difference is 2.5 V.
(b) Describe the relationship between the potential difference and the current.
(c) Use the gradient of the line to determine the resistance of the resistor.
Reading a value off the graph
- To find a value from a graph, go from the known value on one axis to the line of best fit, then across to the other axis.
- Always draw dashed construction lines - Writing down a number without construction lines can lose credit.
Interpolation vs extrapolation
- Interpolation - Reading a value between plotted points.
- Extrapolation - Reading a value beyond the range of plotted points.
- Extrapolation is unreliable because it assumes the relationship continues in the same way, whereas the line might curve or level off. For example, a filament lamp graph is straight at low potential difference but curves as current increases.
Describing a trend and finding a gradient
Describing a trend
- The direction of the relationship.
- Figures from both axes to back it up.
- Any change in behaviour, such as where the line curves or levels off.
Use this sentence structure:
As [independent variable] increases from [value] to [value], [dependent variable] increases / decreases from [value] to [value].
When to use "directly proportional": only when the graph is a straight line that passes through the origin. If the line is curved or does not start at (0, 0), stating it is proportional is incorrect.
Finding a gradient
To find the gradient of a line of best fit:
- Draw a large right-angled triangle using the line of best fit itself, not plotted data points. A large triangle reduces the percentage uncertainty in reading values from the axes.
- For a current-against-potential-difference graph where the line passes through the origin and (5.0 V, 0.41 A):
Since gradient , resistance is .
Common exam questions
Question 1
What is the difference between interpolation and extrapolation?
Interpolation is reading a value between your plotted points, which is fine; extrapolation is reading a value beyond your last point, which is riskier because you have no readings out there.
Question 2
A student reads a current of 0.21 A off a graph and writes just the number. What else is needed?
The construction lines: a line up from the potential difference on the x-axis to the graph line, and a line across to the current on the y-axis, so it can be seen where the value came from.
Question 3
A graph of current against potential difference is a straight line through the origin. Describe the relationship.
As the potential difference increases, the current increases, and because the line is straight and passes through the origin the current is directly proportional to the potential difference.
Question 4
Why can you not describe the graph for a filament lamp as proportional?
Because the line curves rather than staying straight, so doubling the potential difference does not double the current, even though the graph does start at the origin.
Question 5
A line of best fit on a current-against-potential-difference graph passes through the origin and through (4.0 V, 0.32 A). Determine the resistance.
The gradient is , and since that is current divided by potential difference, the resistance is Ω.
Question 6
A student draws a tiny gradient triangle in one corner of the line. Why is a large triangle better?
Because the sides of a small triangle are harder to read accurately, and a small reading error on a short side becomes a large error in the gradient.
Question 7
Why should the gradient triangle be drawn on the line of best fit rather than between two plotted points?
Because the line of best fit already averages out the scatter in the readings; using two individual points puts that scatter straight back into the answer.
Selecting information from a passage or table
In comprehension questions, some data needed for calculations must be extracted directly from a passage or table rather than from the question stem.
Worked example
A passage states:
- Rigel is 860 light-years from Earth.
- Debris is thrown into space at approximately 5% of the speed of light.
To answer:
- "Calculate the distance, in metres, from Rigel to Earth" - Select 860 light-years from the passage and convert it to metres using the data sheet value for 1 light-year.
- "Determine the speed of the debris" - Select 5% from the passage and calculate 0.05 × (3.0 × 108 m/s) = 1.5 × 10⁷ m/s.
Answering contextual vs recall questions
- Data questions - If a required value is stated in the passage or table, extract it directly.
- Explanation questions - The passage provides the context, but the explanation relies on your physics knowledge (e.g. light from a supernova 860 light-years away takes 860 years to reach Earth, so an explosion could have occurred without being observed yet).