2.6 - Velocity-Time Graphs
Reading a velocity-time graph
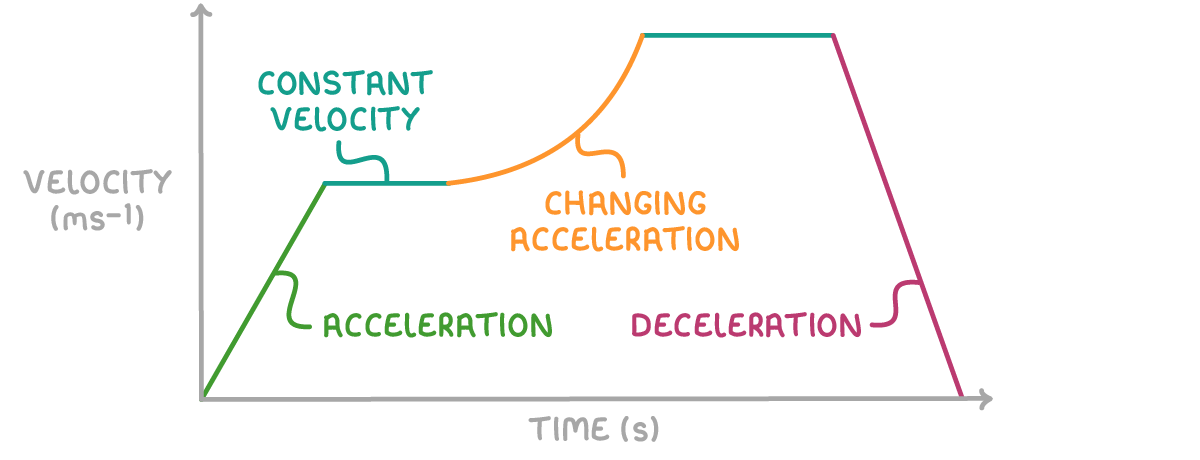
A velocity-time graph shows how an object's velocity changes as time passes.
- A flat section means a steady (constant) velocity.
- An uphill section (going up to the right) means the object is accelerating.
- A downhill section (going down to the right) means the object is decelerating.
- The steeper the line, the greater the acceleration or deceleration.
- A straight line means constant acceleration.
- A curve means the acceleration is changing.
The gradient gives the acceleration
- The gradient (steepness) of a velocity-time graph equals the object's acceleration - it's the change in velocity divided by the time taken.
- For a straight section, divide the change in velocity (the rise) by the time taken (the run).
Finding the acceleration on a curve
- Where the line is curved, the gradient is different at every point.
- To find the acceleration at a particular moment, draw a tangent to the curve at that point and find the gradient of the tangent.
A line below the time axis
- If the line drops below the time axis, the object has a negative velocity.
- This means it's moving in the opposite direction.
The area under a velocity-time graph is the distance
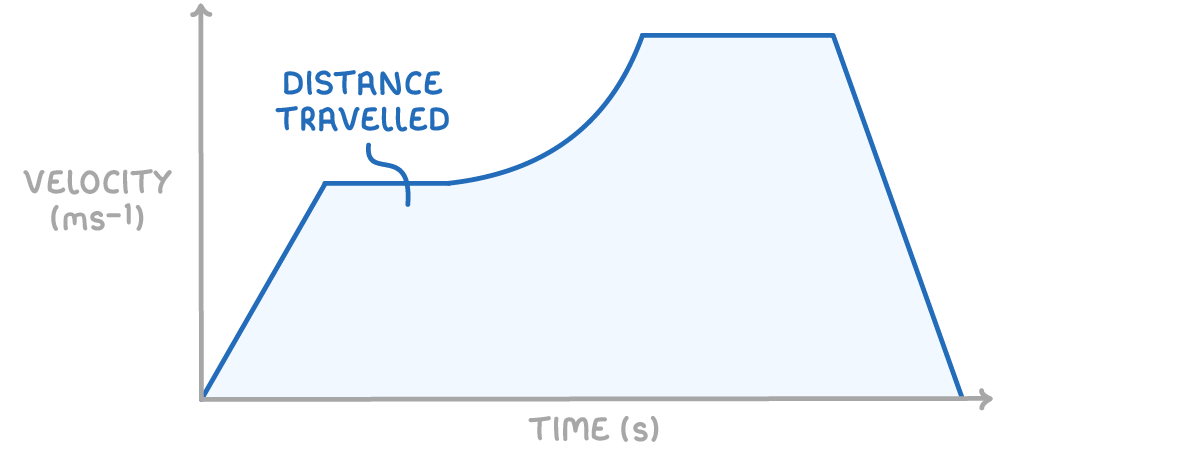
- The area between a velocity-time graph and the time axis equals the distance travelled in that time interval.
- This works for any section of the graph or for the whole journey.
Splitting the area into shapes
Where the acceleration is constant the line is straight, so the area underneath is made of simple shapes. Split it into rectangles and triangles, work out each area, and add them together:
- The area of a rectangle is width × height.
- The area of a triangle is ½ × base × height.
Counting squares for a curve
Where the line is curved the area isn't a simple shape. Estimate it by counting the squares under the line on the graph grid:
- Find the distance one square represents by multiplying the width of a square (in seconds) by its height (in metres per second).
- Count the squares under the line, adding part-squares together to make whole ones.
- Multiply the number of squares by the distance one square represents.
Worked example - Acceleration and distance from the graph
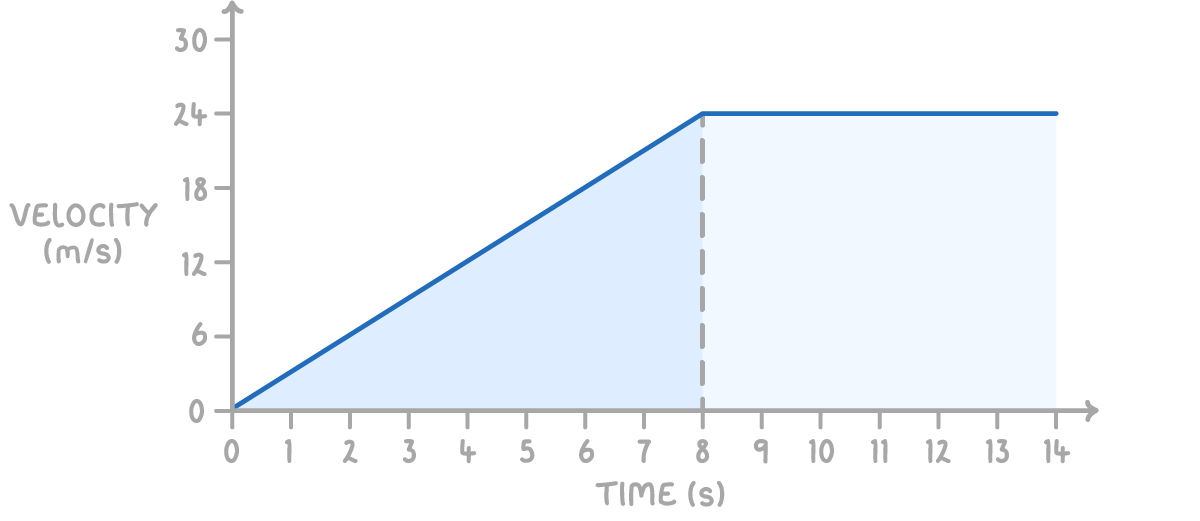
A velocity-time graph shows a car's journey. The velocity rises in a straight line from 0 to 24 m/s over the first 8 s, then stays constant at 24 m/s. Find the acceleration of the car over the first 8 s, and the distance it travels in the first 14 s.
Step 1 - Write down the change in velocity and the time
Change in velocity = 24 − 0 = 24 m/s
Time taken = 8 s
Step 2 - Divide the change in velocity by the time
Acceleration is the gradient over the first 8 s:
Acceleration = 24 ÷ 8 = 3 m/s2
Step 3 - Find the distance as the area under the graph
The distance for the first 14 s is the area under the graph. Split it into a triangle (first 8 s) and a rectangle (next 6 s):
Triangle = ½ × base × height = ½ × 8 × 24 = 96 m
Rectangle = width × height = 6 × 24 = 144 m
Step 4 - Add the areas together
Distance = 96 + 144 = 240 m