9.11 - Frequency of Sound Using an Oscilloscope
The technique
Aim
To measure the frequency of a sound by displaying it on an oscilloscope, reading off the time for one complete cycle, and using that to work out how many cycles happen each second.
Background
- A microphone turns a sound wave into an electrical signal with the same pattern. An oscilloscope draws that signal as a trace, with time along the horizontal axis.
- The height of the peaks above the centre line of the trace shows the amplitude of the sound, which is how loud it is. How tightly the cycles are packed shows the frequency, which is how high-pitched it is.
- The period, , is the time for one complete cycle, in seconds. The frequency is the number of cycles each second, so .
- You can't read the frequency straight off the screen, but you can measure how many divisions one cycle takes up, and the time base says how long each division lasts.
- So in this practical you display a sound on an oscilloscope, measure the period of one cycle, and work out the frequency from it.
Variables
- Independent variable - None when measuring one sound. When comparing sounds, the pitch or loudness of the note.
- Dependent variable - The number of horizontal divisions one complete cycle takes up.
- Control variables - The time base and volts per division settings, and the distance from the speaker to the microphone.
Method - Measuring the frequency of a sound
Set up the sound - plug a microphone into the oscilloscope, and put a sound source about half a metre in front of it. A signal generator and speaker are easiest, because you can check your answer against the frequency set.
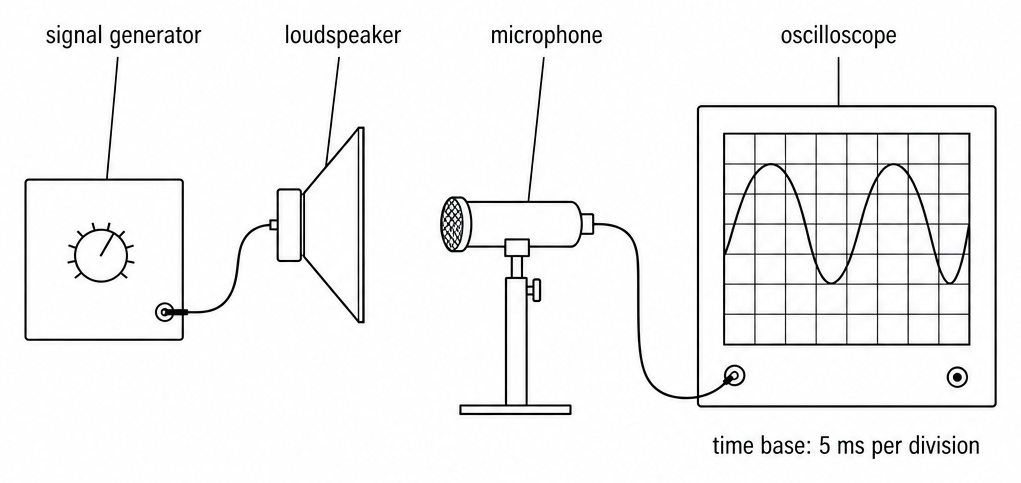
- Adjust the height - Turn the volts per division control until the trace is tall enough to read but still fits on the screen.
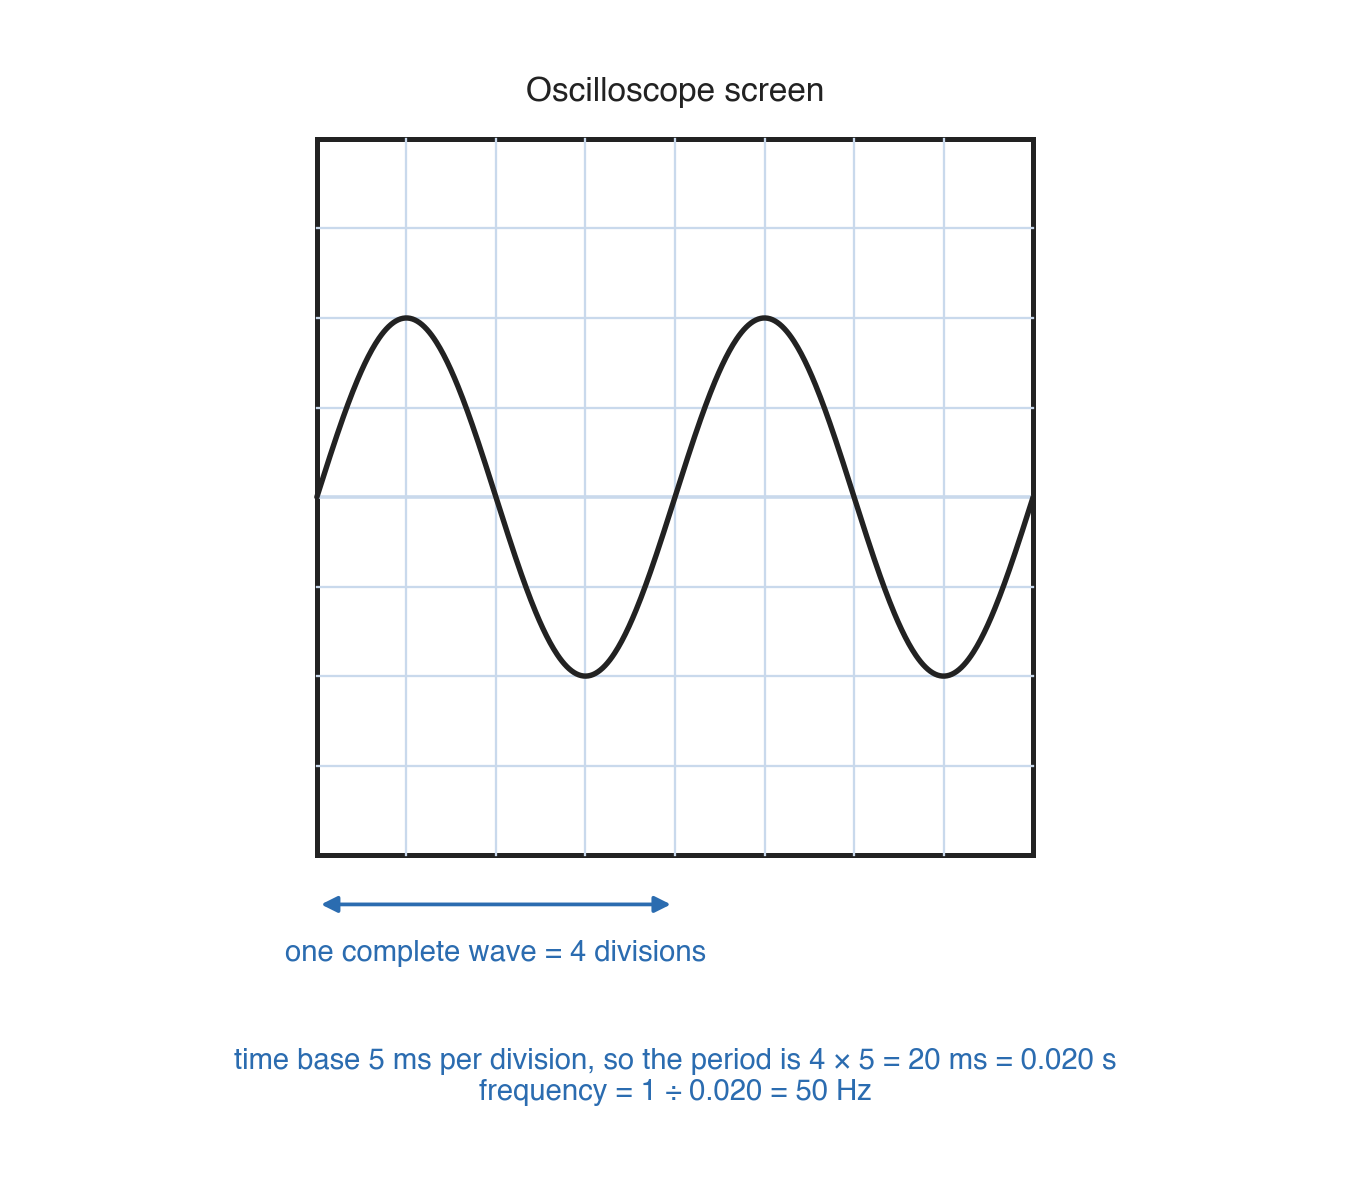
- Adjust the time base - Turn it until one or two complete cycles show across the screen. Write down the setting, such as 2 ms per division, and don't change it again.
- Count the divisions - Count the horizontal divisions for one complete cycle, from one peak to the next, estimating any fraction of a division.
Method - Comparing two sounds
- Keep the settings - Leave the time base and volts per division exactly as they are.
- Change the note - Play a higher-pitched note, then the first note again but louder, and compare each trace with the first one.
Safety
- Loud sounds - Keep the volume moderate, because a loud tone close up for a long time can damage your hearing.
Worked example - Frequency of a note
A student connected a microphone to an oscilloscope and displayed a note from a loudspeaker. The time base was set to 2 ms per division, and one complete cycle stretched across 2.5 divisions. Four complete cycles stretched across 10 divisions. The student could read the screen to about ±0.25 divisions.
Calculate the frequency of the note, check the answer is sensible, and explain how the measurement could be made more precise.
Step 1 - Convert the time base into seconds
Step 2 - Find the period
One cycle takes 2.5 divisions, and each division is 0.002 s.
Step 3 - Find the frequency
Step 4 - Check the answer is sensible
People can hear from about 20 Hz to 20,000 Hz, and 200 Hz is inside that range. If the time base had been left in milliseconds, the working would give and , far too low to hear. An answer outside the range usually means the time base wasn't converted.
Step 5 - Make the reading more precise
Across one cycle, the percentage uncertainty is
Across four cycles, the reading error at the ends is the same, but the length is longer.
The period is the total time divided by the number of cycles.
This gives the same frequency, 200 Hz, with a quarter of the percentage uncertainty.
Common exam questions
Question 1
Two sounds are displayed one after the other on the same settings. Trace A shows 3 complete cycles across the screen and trace B shows 6. Which sound has the higher pitch, and why?
Trace B. Twice as many cycles fit into the same time, so its frequency is twice as high, and a higher frequency means a higher pitch.
Question 2
Why must the time base be left alone when comparing two traces?
Changing it stretches or squashes the trace sideways. You then couldn't tell whether a difference on the screen came from the sound or from the new setting.
Question 3
A tuning fork has a frequency of 3.4 kHz. Work out its period.
3.4 kHz is 3,400 Hz. T = 1 ÷ f = 1 ÷ 3,400 = 0.00029 s to two significant figures, which is 0.29 ms.