8.4 - Reading Graphs & Drawing Conclusions
Reading a value off the graph
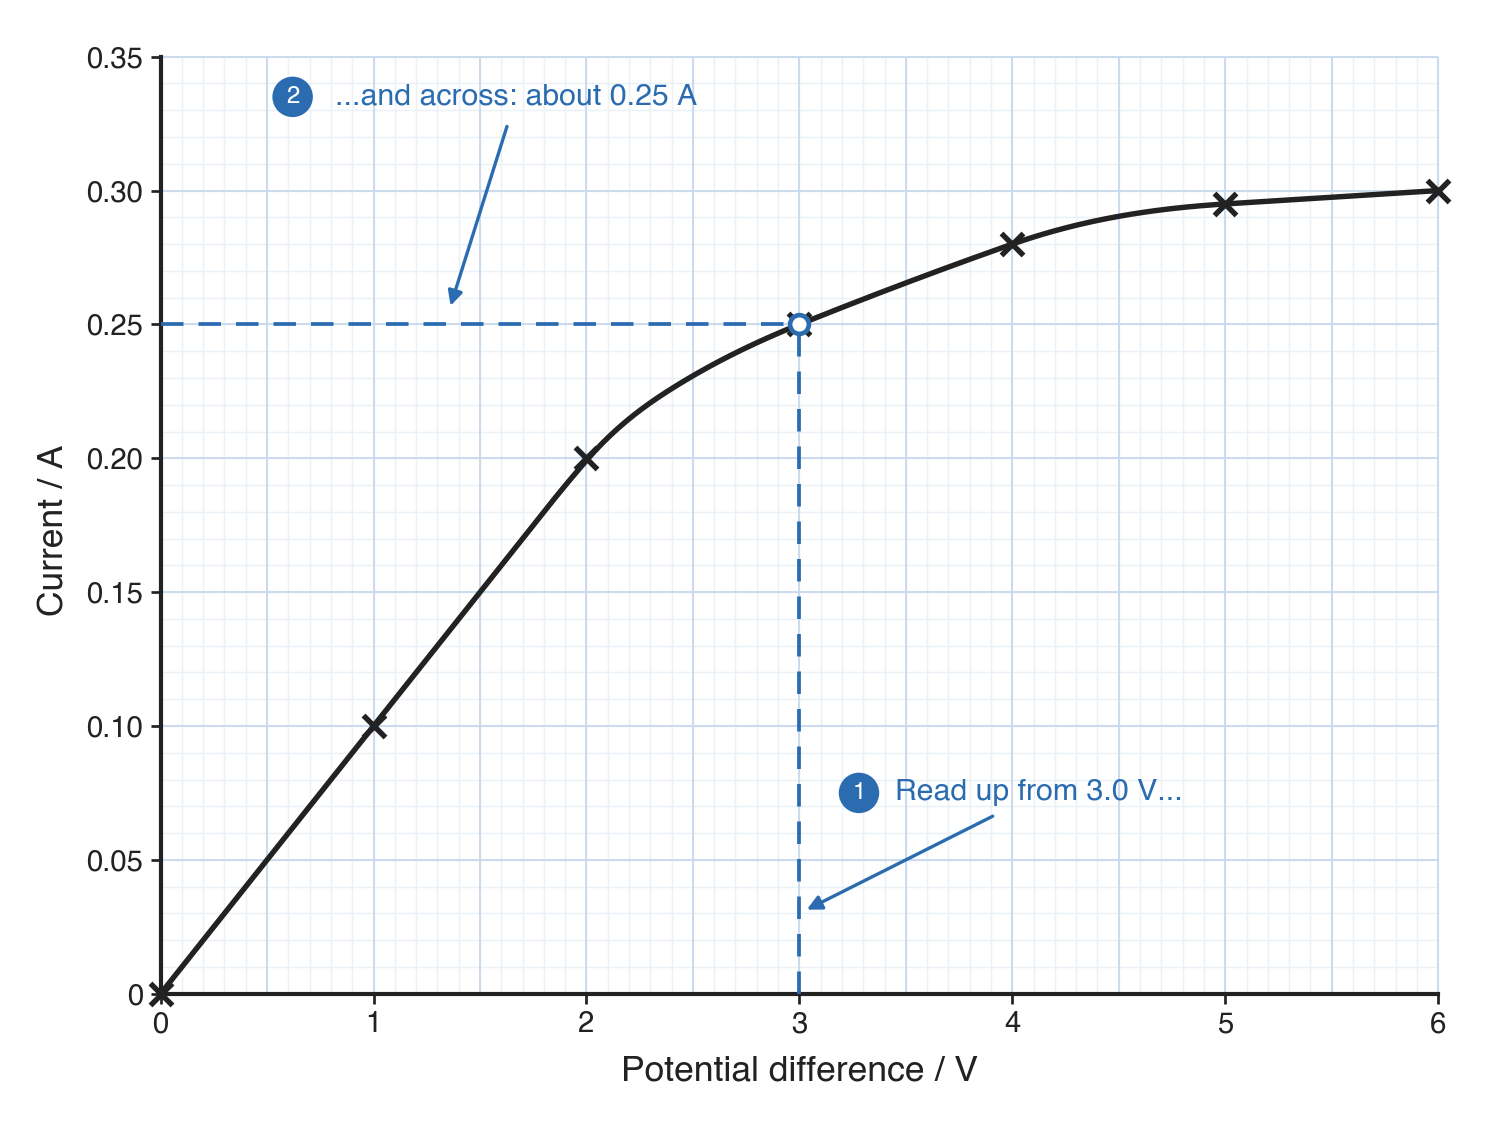
- To read the current at a potential difference of 3.0 V: go up from 3.0 V on the x-axis to the line, then across to the y-axis and read off the value.
- Always draw both dashed construction lines on the graph - giving a number without them can lose the mark.
Interpolation vs extrapolation
- Interpolation - Reading a value between your plotted points.
- Extrapolation - Reading a value beyond your plotted points, which is unreliable because you're guessing the trend continues.
Describing a trend
A trend answer needs three things:
- The direction the line goes
- Data from the axes to support it
- Any change in pattern, such as where the line curves or levels off
As [the independent variable] increases, [the dependent variable] increases / decreases, from [figure] to [figure], then levels off at [value].
For example, on a filament lamp graph: "As the potential difference increases from 0 to 6.0 V, the current increases from 0 to about 0.30 A, but each extra volt adds less current than the one before, and the line flattens above about 4.0 V."
Only describe a relationship as directly proportional if the line is straight and passes through the origin (0, 0).
Drawing a conclusion
- A conclusion answers the question the experiment set out to ask: how the variable you changed affects the variable you measured.
- It must link both variables:
As the [independent variable] increased, the [dependent variable] increased (or decreased).
For the filament lamp graph: "as the potential difference across the lamp increased, the current through it increased".
Rules for conclusions
- Match the range tested - A conclusion only applies to the values you actually measured, not beyond them.
- Link both variables - Saying "the current went up" is a single observation, not a relationship between two variables.
- State what happened, not why - Saying the filament heats up and its resistance increases is an explanation, not a conclusion.
TermDefinition
InterpolationReading a value from a graph between the plotted points.
ExtrapolationReading a value from a graph beyond the range of the plotted points, by extending the line.
Directly proportionalA relationship between two quantities where doubling one doubles the other, so their graph is a straight line through the origin.
Key points to remember
How were these notes?