4.5 - Radioactive Decay & Half-Life
Count-rate and activity
Radioactive substances emit radiation from the nuclei of their atoms.
Count-rate
- The count-rate is the number of radiation counts picked up by a detector each second.
- A common detector is a Geiger-Muller tube, connected to a counter that displays the number of counts.
- Photographic film can also detect radiation: it becomes darker the more radiation it's exposed to.
Activity
- The activity is the rate at which a source decays.
- It's measured in becquerels (Bq), where 1 Bq is 1 decay (one nuclear disintegration) per second.
- A larger radioactive sample has a higher activity, because it contains more radioactive nuclei that can decay.
Radioactive decay and half-life
Radioactive decay is random and spontaneous:
- Random - It's impossible to predict which nucleus will decay next, or exactly when any one nucleus will decay.
- Spontaneous - The rate of decay isn't affected by physical conditions like temperature, pressure or chemical bonding.
Why activity falls
- Each time a nucleus decays it becomes more stable, so the number of undecayed radioactive nuclei steadily falls.
- With fewer radioactive nuclei left, the activity (and count-rate) of the sample decreases over time.
Half-life
- The half-life is the time taken for the number of radioactive nuclei in a sample to halve.
- This is also the time taken for the activity (or count-rate) of a sample to halve.
- Each isotope has its own fixed, characteristic half-life.
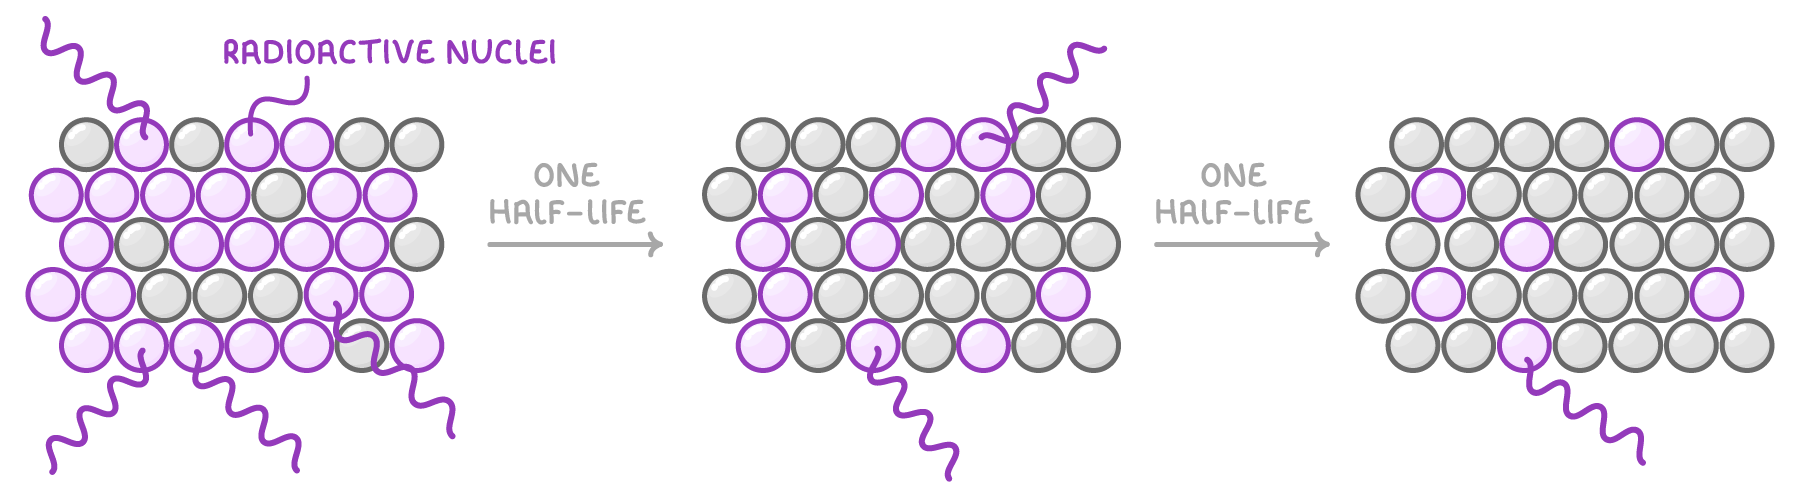
Purple nuclei are still radioactive; grey nuclei have already decayed.
Half-life and hazard
- Short half-life - Activity falls quickly: high radiation at the start, but the source soon becomes safe.
- Long half-life - Activity falls slowly: smaller amounts of radiation released, but for a very long time, so nearby areas stay exposed.
Finding half-life from a decay graph
A graph of activity (or count-rate, or number of radioactive nuclei) against time curves downwards, becoming less steep as time goes on.
Reading the half-life off the curve
- Read the initial value off the vertical axis.
- Work out half of this value.
- Find the time on the horizontal axis at which the curve reaches that halved value - that time is one half-life.
- Check by halving again: each successive halving should take the same length of time.
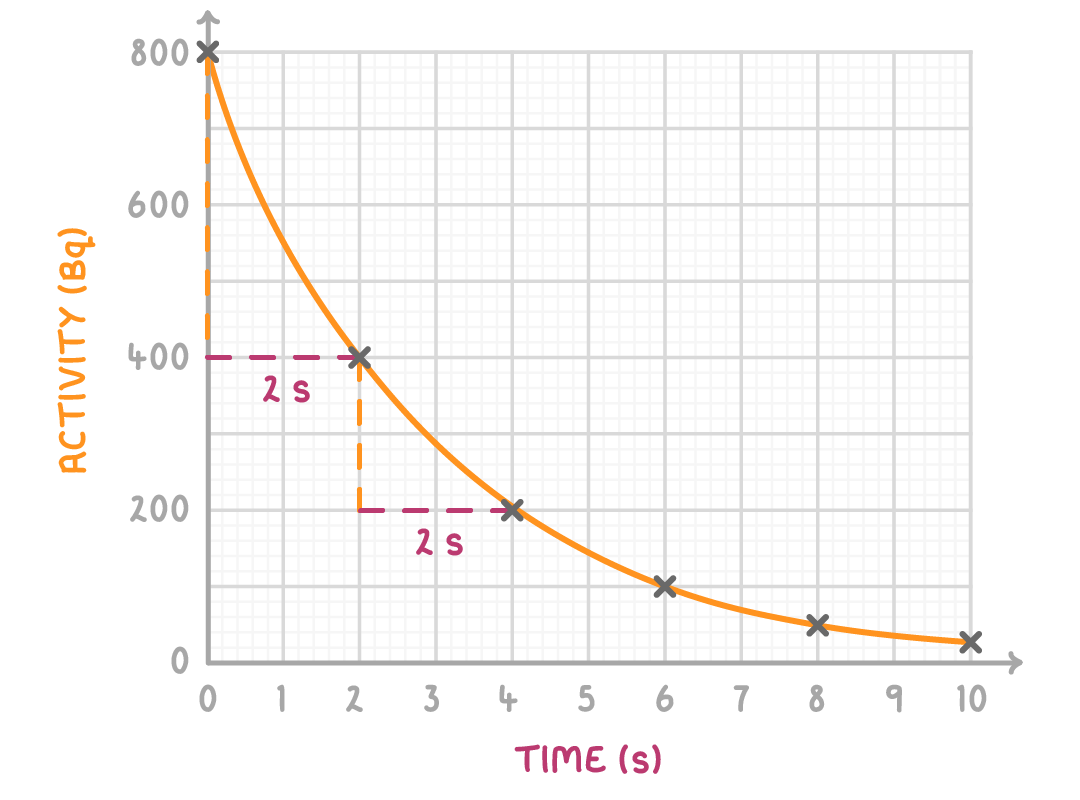
Subtract the background count first
- Before plotting, subtract the background count from every reading.
- If it isn't removed, the calculated half-life will be incorrect.
Worked example - Number of half-lives from an activity drop
The initial activity of a sample is 1,200 Bq. After 50 minutes the activity has fallen to 300 Bq. How many half-lives has the sample undergone in 50 minutes?
Step 1 - Halve repeatedly until the final activity is reached
1,200 Bq ÷ 2 = 600 Bq (1 half-life)
600 Bq ÷ 2 = 300 Bq (2 half-lives)
Step 2 - Count the halvings
The activity was halved twice to reach 300 Bq, so the sample has undergone 2 half-lives in 50 minutes.
TermDefinition
Count rateThe number of decays recorded by a detector in a given time, usually each second.
ActivityThe rate at which a source of unstable nuclei decays, measured in becquerels (Bq).
Half-lifeThe time taken for the number of radioactive nuclei in a sample to halve, or for the activity (count rate) of the sample to fall to half its original value.