5.9 - Distance-Time Graphs
Reading a distance-time graph
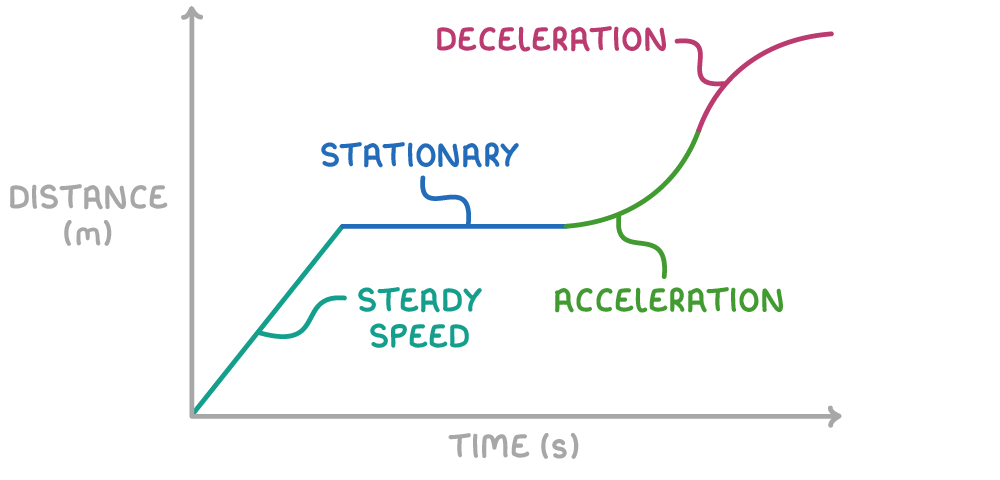
- A distance-time graph shows how far an object has travelled from its starting point over time.
- A flat section means the object is stationary (at rest) - the distance doesn't change.
- A straight, sloping section means the object is moving at a steady speed - the steeper the line, the faster it's going.
- A curve means the speed is changing (accelerating or decelerating):
- A curve that gets steeper means the object is speeding up.
- A curve that levels off means the object is slowing down.
Finding speed from the gradient
- The gradient (slope) of a distance-time graph at any point equals the speed of the object at that point.
- For non-uniform speed, the average speed is the total distance travelled divided by the total time taken.
Formula for speed
Worked example - Speed from a straight section
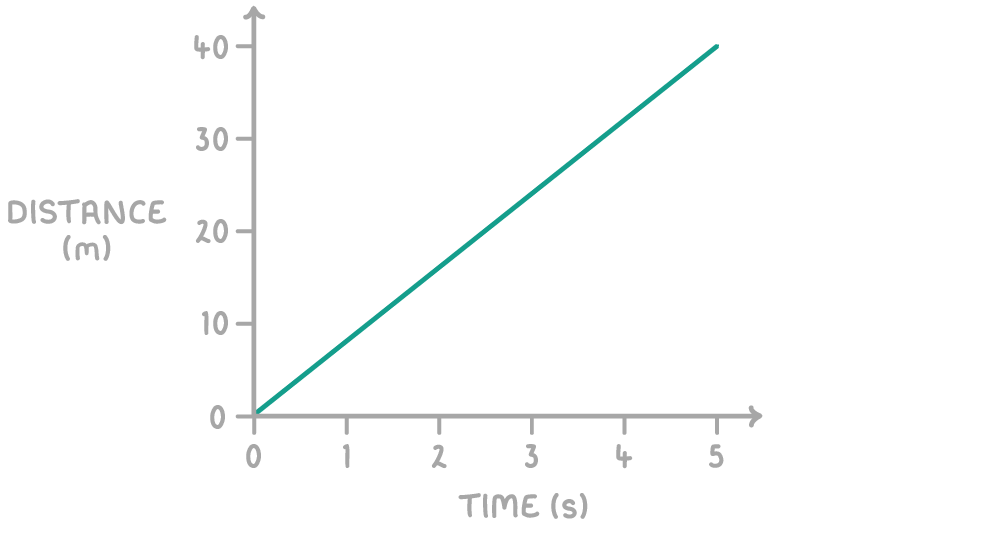
A runner moves in a straight line. On a distance-time graph, a straight section of the line rises from 0 m to 40 m between 0 s and 5 s. Calculate the runner's speed during this section.
Step 1 - Read the change in distance and change in time
Change in distance = 40 m - 0 m = 40 m
Change in time = 5 s - 0 s = 5 s
Step 2 - Find the gradient
The runner's speed during this section is 8 m/s.