9.4 - Plotting Graphs & Bar Charts
What a graph question looks like
You're usually given a table of results and asked to plot them or complete a partly drawn graph.
The five things you're marked on
- Chart type - A line graph for continuous data, a bar chart for categorical data.
- Axis labels - Label both axes with the quantity and its unit, written as "quantity (unit)".
- Scale - A linear scale so the plotted data fills a good part of the grid in both directions.
- Plotting - Plot every point accurately.
- Best fit - Draw a line or curve of best fit through the points.
A typical question
The progress of a reaction was monitored by measuring the volume of hydrogen gas produced. Complete the graph to show the volume of gas produced against time.
Setting up a graph
Line graph or bar chart?
A line graph is used for continuous data and a bar chart for categorical data.
- Line graph - Use when the variable changed is a continuous number, such as time, temperature, or volume.
- Bar chart - Use when the data is split into separate named categories (e.g. types of plastic) rather than a continuous scale.
Choosing and labelling the axes
- The variable you change goes on the x-axis (along the bottom).
- The variable you measure goes on the y-axis (up the side).
- Label each axis with the quantity and its unit, written as "quantity (unit)" - for example, Time (min) and Volume of gas produced (cm3).
Choosing the scale and plotting the points
A linear scale that fills the grid
- Find the biggest value you need to fit on each axis.
- Pick an interval that reaches near the top of the grid and is easy to plot - going up in 1s, 2s, or 5s per square.
- Linear means equal steps for equal squares all the way along. A scale running 0, 10, 20, 50, 100 is not linear.
Plotting points as crosses
Plot each reading as a small cross, not a large dot.
Worked example - Volume of gas against time
A student measured the volume of hydrogen gas produced when calcium reacts with water.
| Time (min) | 0 | 1 | 2 | 3 | 4 | 5 |
|---|---|---|---|---|---|---|
| Volume of gas produced (cm3) | 0 | 32 | 40 | 46 | 48 | 48 |
Step 1 - Choose the chart type and axes
Time is continuous, so this is a line graph. Time goes on the x-axis; volume goes on the y-axis.
Step 2 - Work out the scale
The x-axis needs to reach 5 minutes, so one large square is worth 1 minute. The y-axis needs to reach 48 cm3, so one large square is worth 10 cm3.
Step 3 - Plot the points
Plot each reading as a cross.
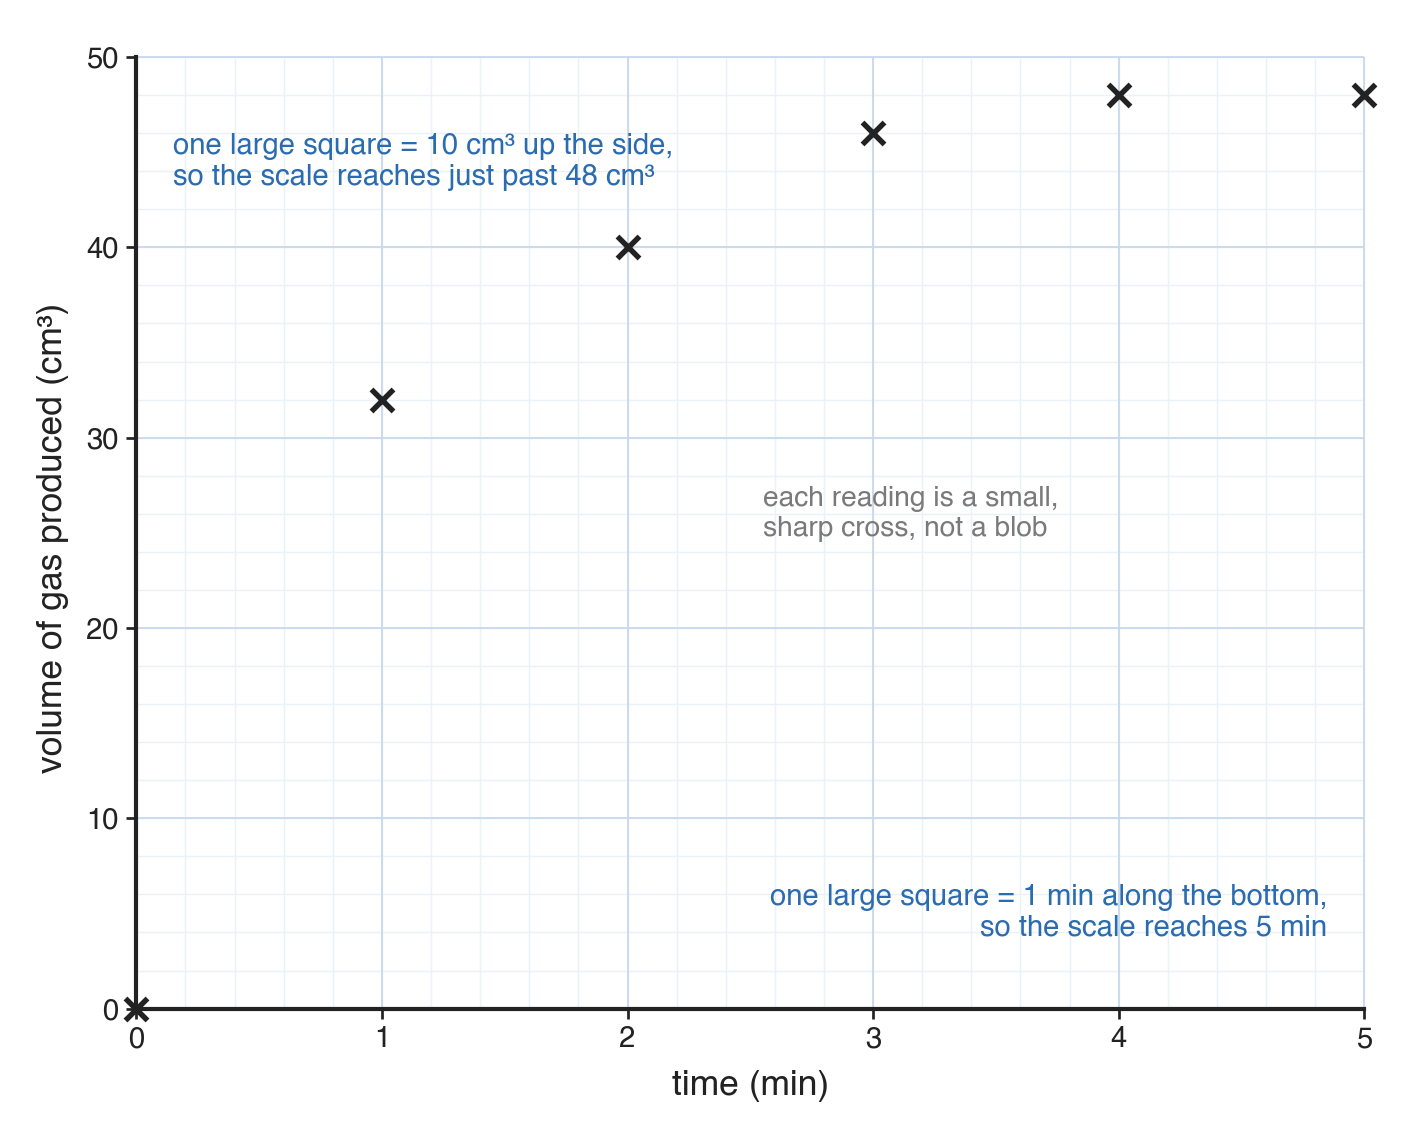
No line yet: the points are plotted first, and the line comes next.
Drawing a line or curve of best fit
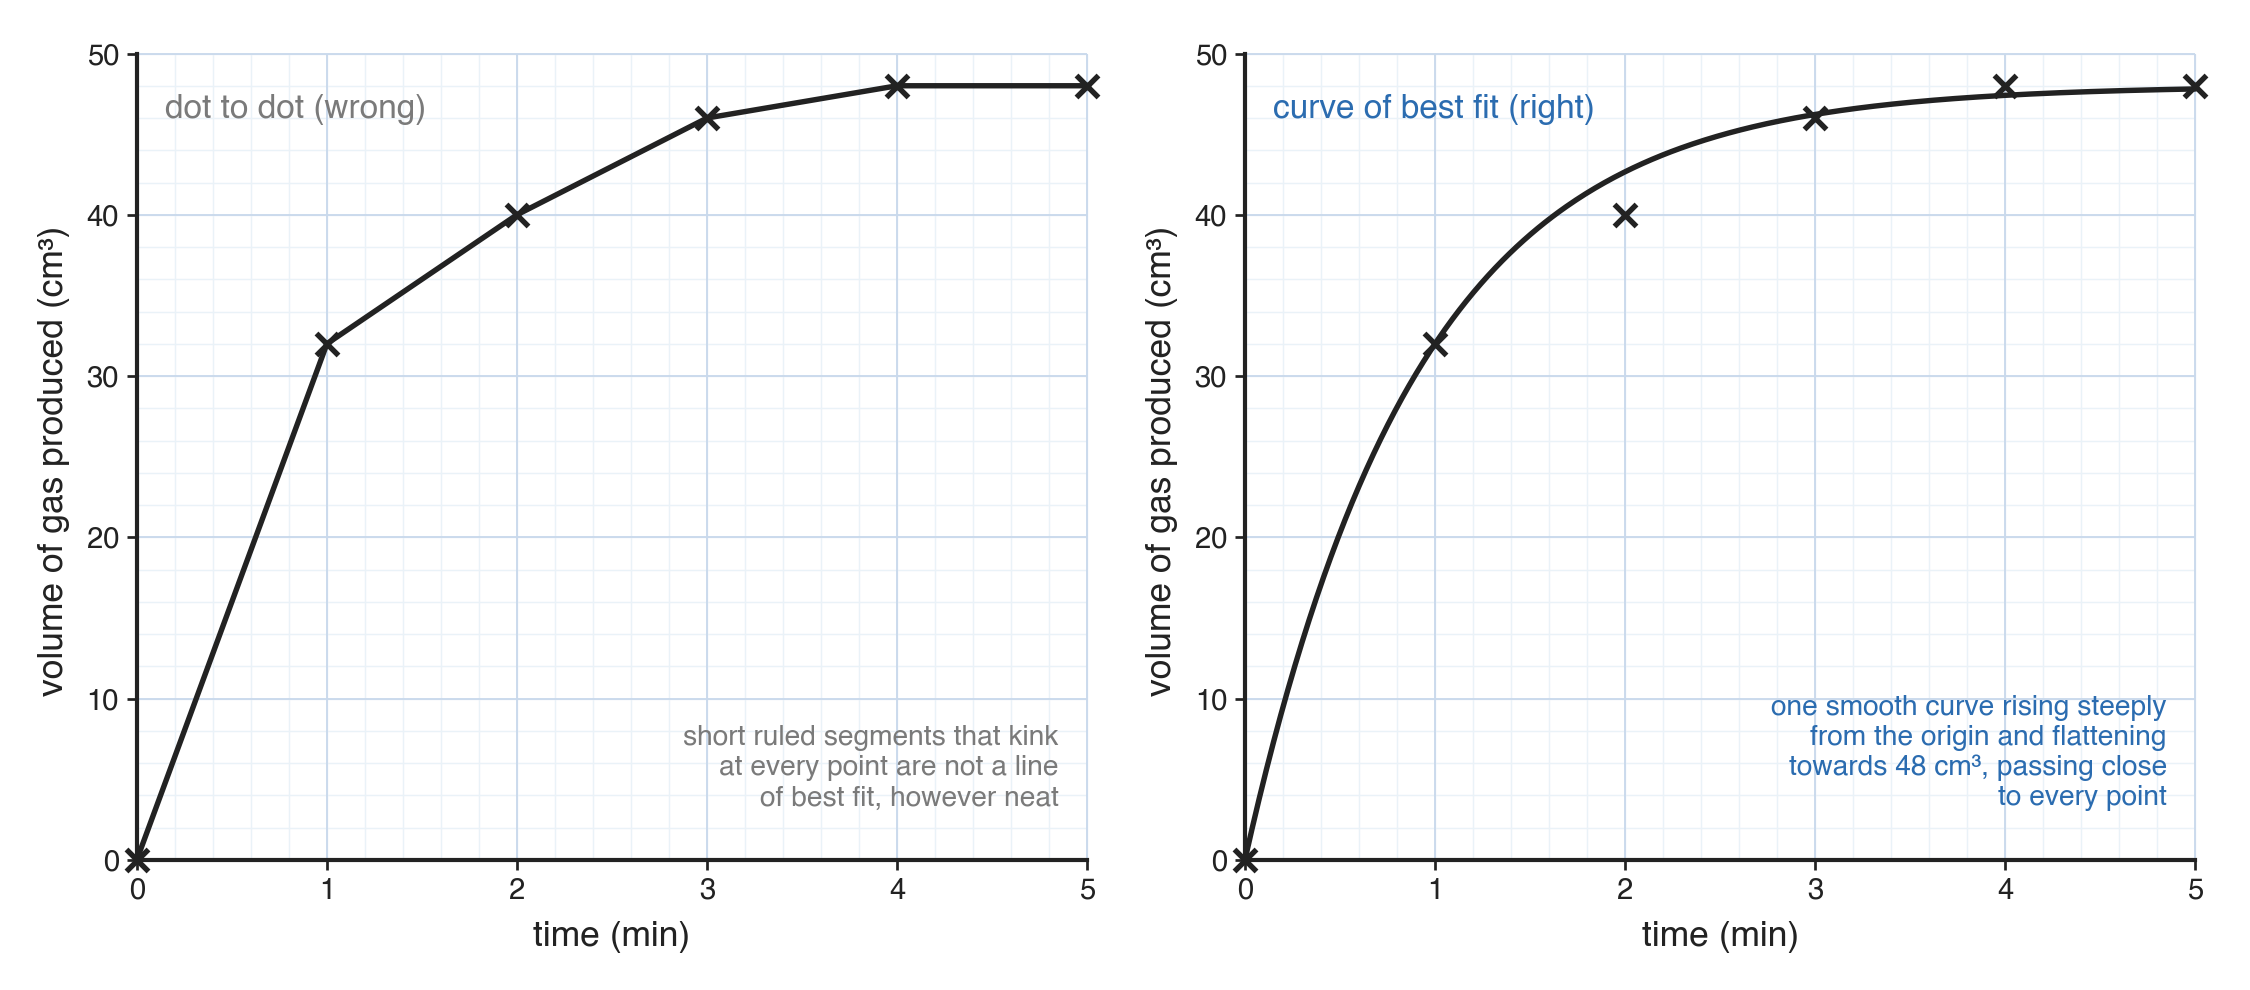
A line or curve of best fit passes through the middle of your points to show the trend, rather than joining points dot to dot with a zigzag of short lines.
Line or curve depends on the data
- Whether you draw a straight line or a curve depends on the pattern of the points.
- If the points bend - such as gas volume rising quickly and then levelling off - draw a smooth curve.
Common exam questions
Question 1
A table gives the volume of gas produced by a reaction at six different times. Should it be a line graph or a bar chart?
A line graph, because time is a continuous variable. Label both axes with quantity and unit, choose a linear scale that fills the grid, plot each point as a cross, and draw a line or curve of best fit through them.
Question 2
A student is given the percentage uses of a plastic, split into five named categories, and asked to redraw it as a graph. Should the results be shown as a line graph or a bar chart?
A bar chart, because the categories are not points on a continuous scale; there is nothing in between one named use and the next.
Question 3
A student plotted every point accurately and then joined them with short ruled lines from one point to the next. What is wrong with this?
It is a dot-to-dot join rather than a line or curve of best fit. National 5 Chemistry wants a single line or smooth curve drawn through the middle of the points, not a zigzag joining them.
Question 4
A reaction's gas-volume graph rises steeply at first and then flattens out. Should the line of best fit be straight or curved?
Curved. The points themselves bend, showing the reaction slowing down, so a smooth curve of best fit follows that shape; forcing a straight line through bending points would not represent the trend.
Question 5
A student uses a scale that runs 0, 10, 20, 50, 100 up the y-axis. Why is this a problem?
It is not linear, because equal squares do not represent equal steps. It also makes anything read off the graph afterwards unreliable.
Question 6
A student's plotted points fill only about a third of the grid. What should have been done differently?
A scale should have been chosen from the largest values in the data, so the points spread across a good part of the grid in both directions.
Question 7
When does a graph need a key?
When more than one set of data is plotted on the same grid, so the key can say which line or set of bars is which.