4.11 - Instrumental Methods of Analysis
Instrumental methods of analysis and their advantages
- An instrumental method uses a machine to detect and identify the elements and compounds in a sample, in place of a chemical test done by hand.
- The machine measures the sample and presents its result as a chart or a table of numbers.
Three advantages over chemical tests
- Sensitive - They detect very small amounts of a substance, far less than a chemical test needs for a visible result.
- Accurate - The result is a measurement made by the machine, not a judgement made by eye.
- Fast (rapid) - Measurements are quick, and machines can be automated to run samples continuously.
Reading an instrumental result
- The result is compared against reference data - the results the same machine gives for known substances.
- The known substance whose data matches the sample's is the substance in the sample.
Mass spectroscopy and its chart
- Mass spectroscopy (also called mass spectrometry) finds the relative molecular mass of an unknown compound, or the relative atomic mass of an unknown element.
- Inside the machine, an electron is removed from each molecule of the sample to form a positive molecular ion.
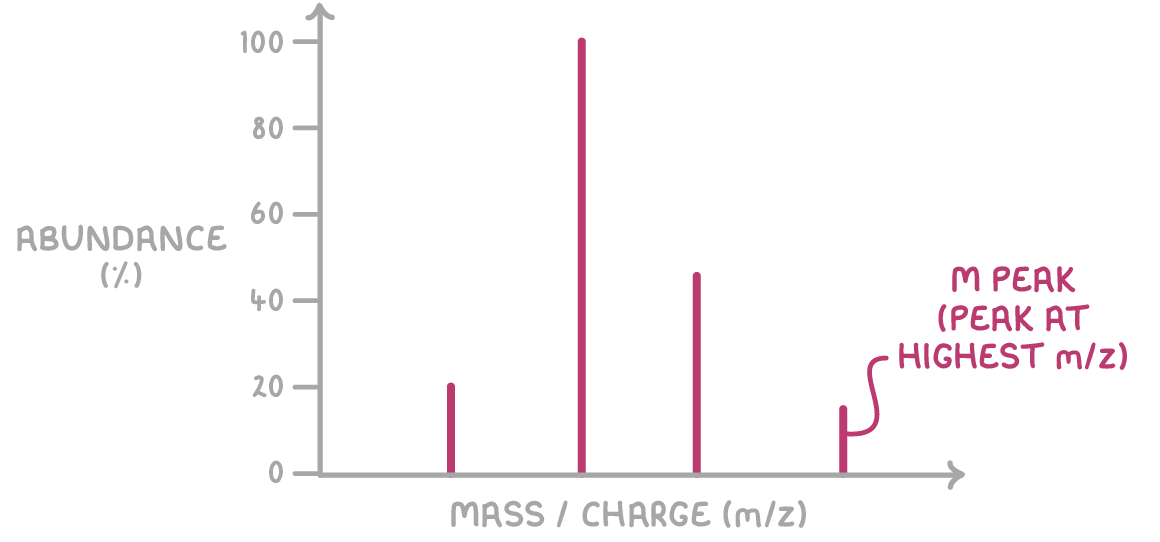
- The machine sorts these ions by mass and draws the result as a chart called a mass spectrum.
The two axes
- Horizontal axis - The mass/charge ratio, written m/z. Because each molecular ion has a 1+ charge, its m/z value equals the relative molecular mass of the molecule it came from.
- Vertical axis - The abundance of the ions (how many of that kind).
Reading a mass spectrum
- Find the peak at the highest mass/charge value on the chart - the molecular ion peak, or M peak.
- Read its m/z value off the horizontal axis. That value is the relative molecular mass of the compound.
- Match that relative molecular mass against reference data to identify the compound.
Worked example - Relative molecular mass from a spectrum
A mass spectrum is recorded for an unknown alkane. Using the reference set below, identify the alkane.
| Alkane | Relative molecular mass |
|---|---|
| methane | 16 |
| ethane | 30 |
| propane | 44 |
| butane | 58 |
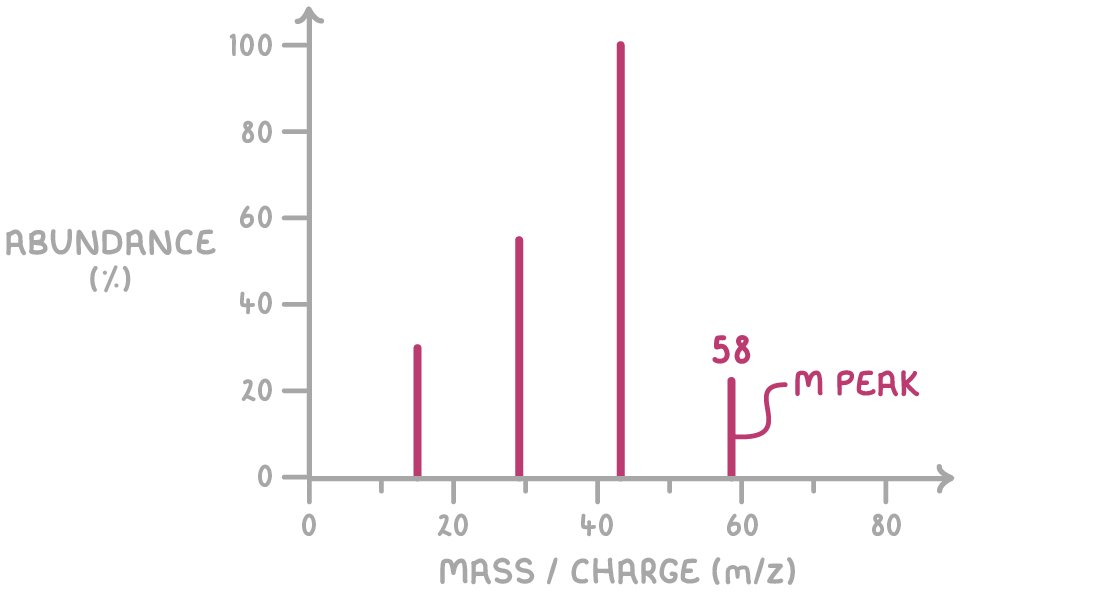
Step 1 - Find the M peak
The peak furthest to the right on the chart is the molecular ion peak (M peak).
Step 2 - Read its m/z value
The M peak stands at m/z 58, so the relative molecular mass of the alkane is 58.
Step 3 - Match against the reference set
The alkane with a relative molecular mass of 58 is butane.
TermDefinition
Instrumental methodA method of analysis that uses a machine to detect and identify the elements and compounds in a sample.
Mass spectroscopyAn instrumental method that finds the relative molecular mass of an unknown compound, or the relative atomic mass of an unknown element.
Molecular ion peakThe peak at the highest mass/charge value on a mass spectrum, which gives the relative molecular mass of the compound.
Key points to remember
How were these notes?