9.3 - Instrumental Methods of Analysis
Instrumental methods of analysis and their advantages
- An instrumental method uses a machine to detect and identify the elements and compounds in a sample, in place of a chemical test done by hand.
- The machine measures the sample and presents its result as a chart or a table of numbers.
Three advantages over chemical tests
- Sensitive - They detect very small amounts of a substance, far less than a chemical test needs for a visible result.
- Accurate - The result is a measurement made by the machine, not a judgement made by eye.
- Fast (rapid) - Measurements are quick, and machines can be automated to run samples continuously.
Reading an instrumental result
- The result is compared against reference data - the results the same machine gives for known substances.
- The known substance whose data matches the sample's is the substance in the sample.
Flame emission spectroscopy - Reading its output
- Flame emission spectroscopy (also called flame photometry) identifies the metal ions in a dilute solution and measures how concentrated each one is.
- Its result is a line spectrum: a set of bright lines, each at its own position along a scale of wavelength.
Identifying the metal ions
- Every metal ion gives its own unique line spectrum.
- Compare the spectrum against reference data for known metal ions. An ion is in the sample when every one of its lines appears in the sample's spectrum.
- A solution holding more than one metal ion gives a single spectrum carrying all their lines together.
- A flame test can't do this: it works only on a single metal ion (mixtures give a blended colour) and relies on judging colour by eye.
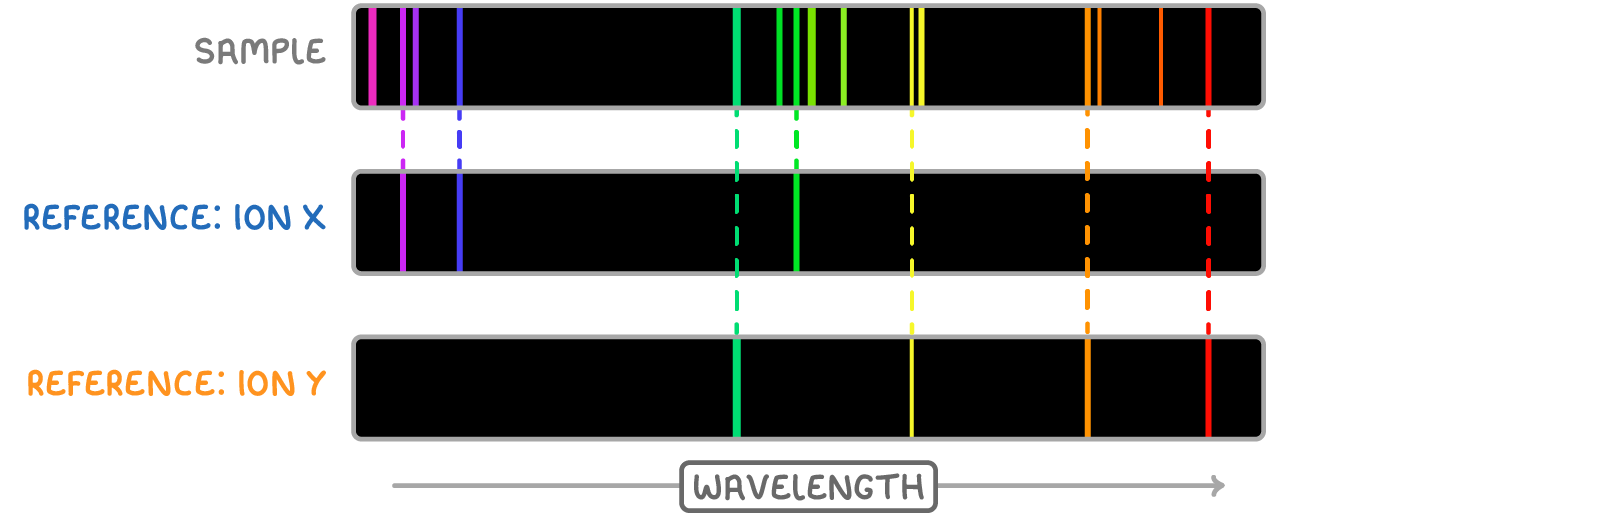
Every line of ions X and Y appears in the sample, so both are present.
Finding the concentration
- The brighter a line is, the more concentrated the ion that produced it. This brightness is called the emission intensity.
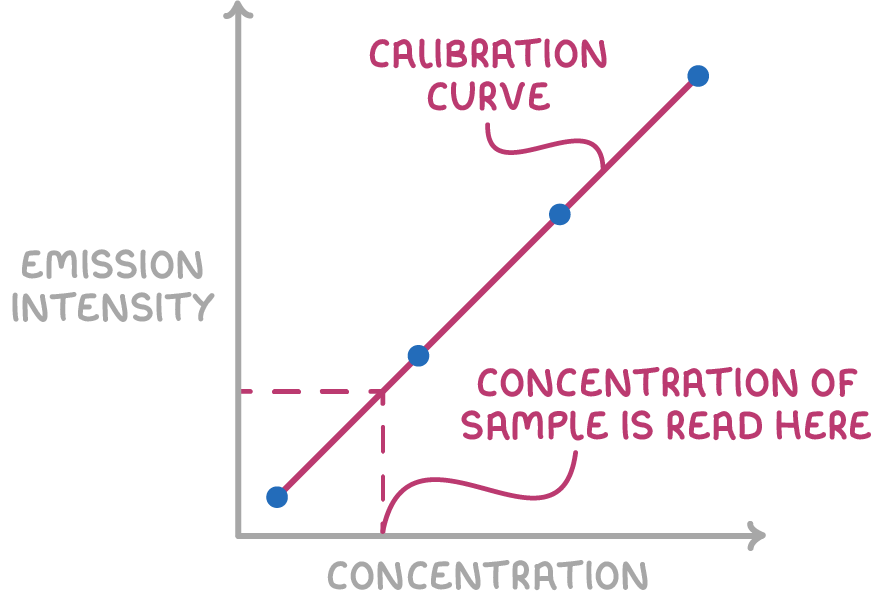
- A calibration curve is a graph of emission intensity against concentration, plotted in advance from solutions of known concentration.
To read a concentration off a calibration curve:
- Find the measured emission intensity on the vertical axis.
- Go horizontally across from that point to the curve.
- Go straight down from the curve to the horizontal axis, and read off the concentration.
Worked example - Concentration from a calibration curve
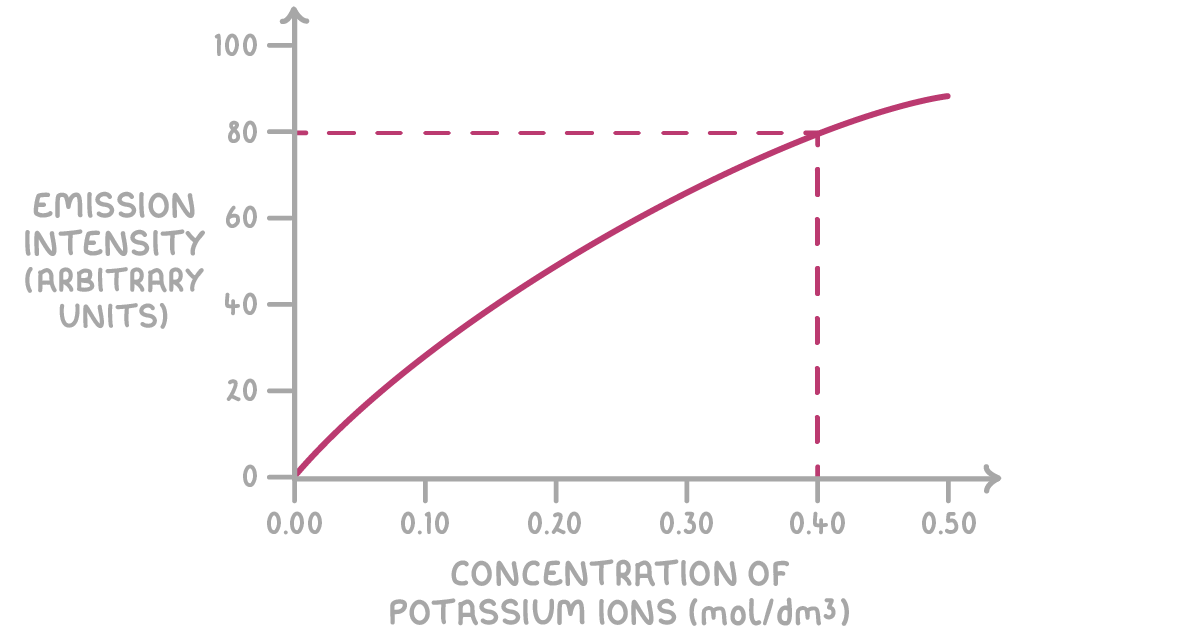
A dilute solution containing potassium ions is analysed with a flame photometer. The emission intensity measured for the potassium line is 80 arbitrary units, and a calibration curve for potassium ions is supplied. Find the concentration of potassium ions.
Step 1 - Find the measured intensity on the vertical axis
The measured intensity is 80 arbitrary units, so start at 80 on the emission intensity axis.
Step 2 - Go across to the curve
Draw a horizontal line from 80 until it meets the curve.
Step 3 - Go down and read off the concentration
- Drop straight down from the curve to the horizontal axis, which it meets at 0.40.
- The concentration of potassium ions is 0.40 mol/dm3.
TermDefinition
Instrumental methodA method of analysis that uses a machine to detect and identify the elements and compounds in a sample.
Calibration curveA graph of emission intensity (how bright the light given out is) against concentration, plotted first using solutions of known concentration.
Flame emission spectroscopyAn instrumental method that analyses the metal ions in a solution to identify them and measure their concentration.
Key points to remember
How were these notes?