5.1 - Exothermic & Endothermic Reactions
Exothermic and endothermic reactions
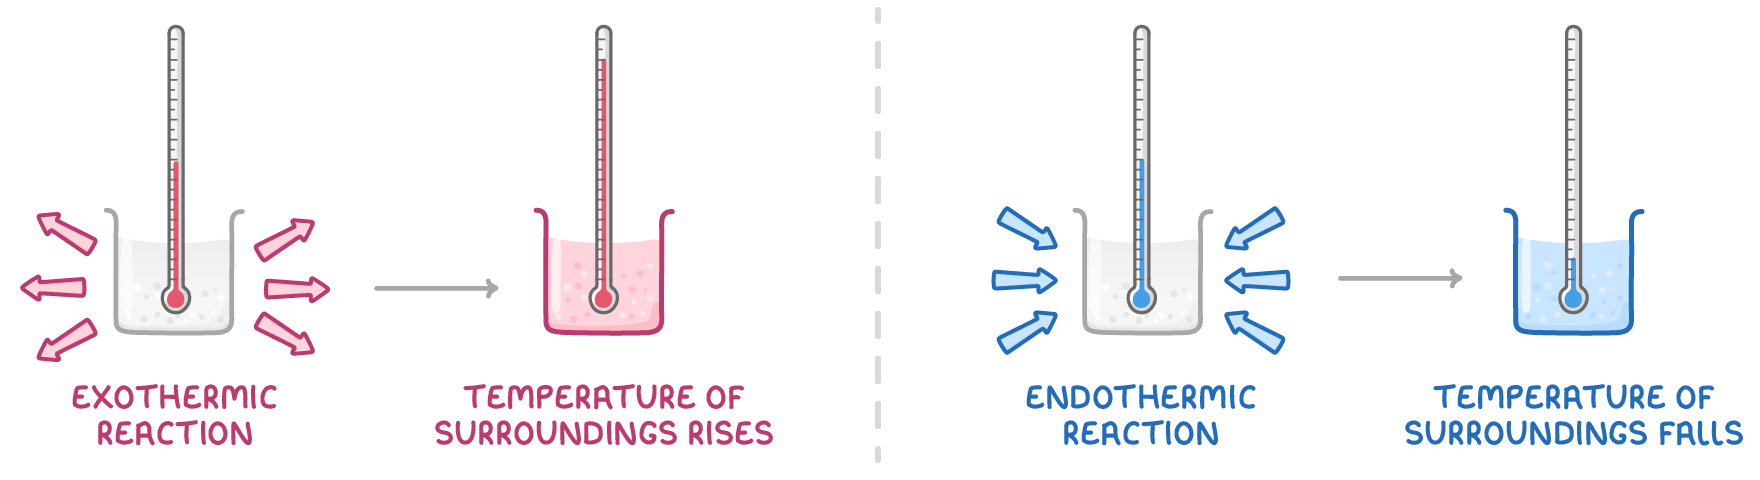
- In an exothermic reaction, energy is transferred to the surroundings, so the temperature of the surroundings rises.
- In an endothermic reaction, energy is taken in from the surroundings, so the temperature of the surroundings falls.
Energy is conserved
- Energy can't be created or destroyed, only transferred.
- In an exothermic reaction, the products hold less energy than the reactants because energy was released to the surroundings.
- In an endothermic reaction, the products hold more energy than the reactants because energy was taken in from the surroundings.
Sign of the energy change
- Negative (−) - Energy given out (exothermic).
- Positive (+) - Energy taken in (endothermic).
| Exothermic reaction | Endothermic reaction | |
|---|---|---|
| Energy is | transferred to the surroundings | taken in from the surroundings |
| Temperature of the surroundings | rises | falls |
| Compared with reactants, products | hold less energy | hold more energy |
Reaction profiles
A reaction profile (or reaction pathway diagram) shows how the energy stored in the chemicals changes during a reaction.
The axes and levels
- Vertical axis - Energy stored in the chemicals.
- Horizontal axis - Progress of the reaction (from left to right).
- Reactants and products are drawn as horizontal lines.
Reading direction from the levels
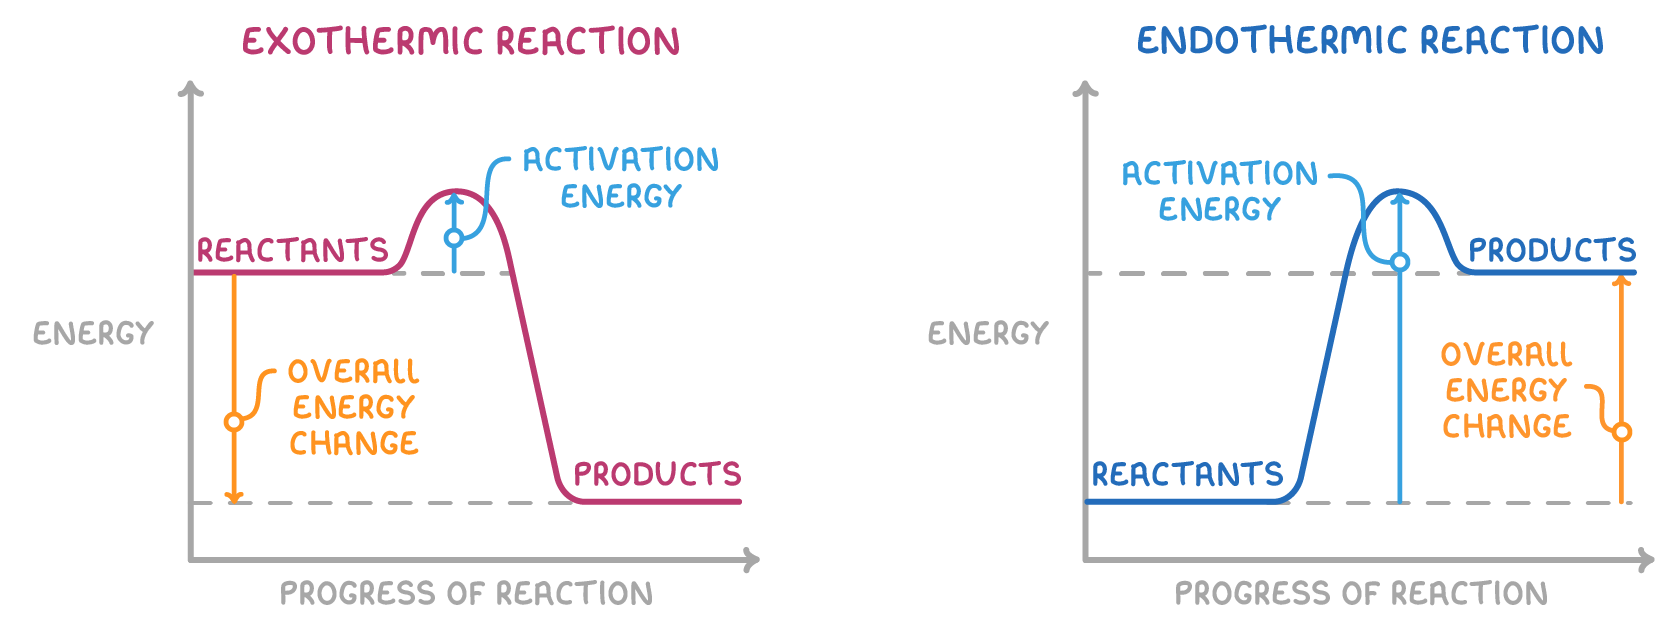
- Exothermic - The products are at a lower energy level than the reactants because energy is transferred to the surroundings.
- Endothermic - The products are at a higher energy level than the reactants because energy is taken in from the surroundings.
- The vertical gap between the reactants and products represents the overall energy change.
Activation energy on a profile
- The curve rises from the reactants to a peak before falling to the products.
- The activation energy is the height of the curve measured from the reactants' level to the top of the peak.
Drawing a fully labelled profile
- Axes - Energy on the vertical axis, progress of reaction on the horizontal axis.
- Levels - Reactants on the left, products on the right (products lower for exothermic, higher for endothermic).
- Curve - Starts at reactants, rises to a peak above both levels, then meets the products.
- Labels - An arrow from the reactants' level to the peak for activation energy, and an arrow between the reactants' and products' levels for the overall energy change.
Worked example - Drawing a reaction profile
A reaction is carried out in which the reactants store more energy than the products. Draw and label a reaction profile, marking the activation energy and the overall energy change, and state whether the reaction is exothermic or endothermic.
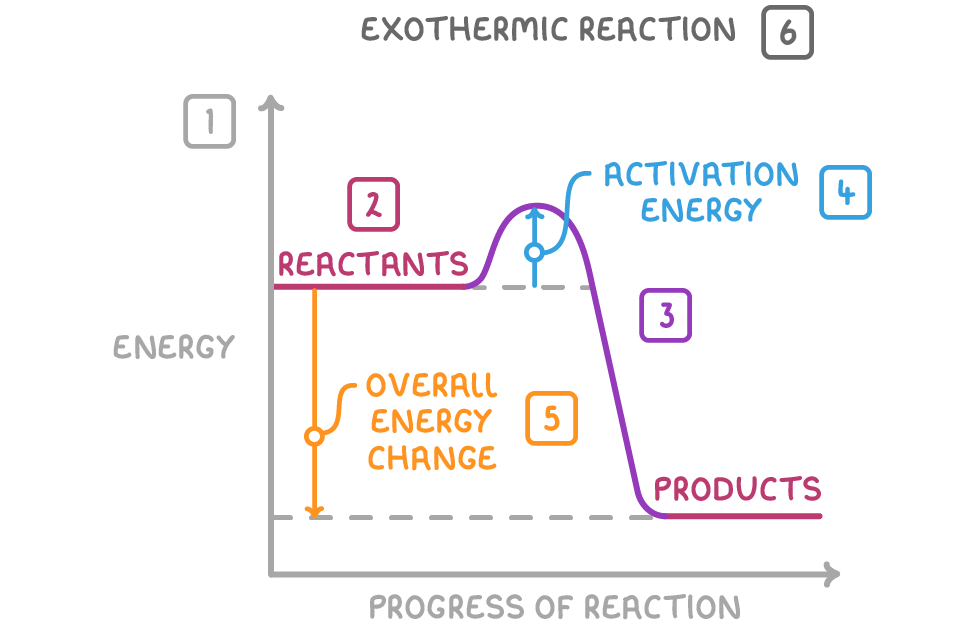
Step 1 - Draw and label the axes
Plot energy on the vertical axis and progress of the reaction on the horizontal axis.
Step 2 - Mark the reactant and product levels
Draw a horizontal line for reactants on the left. Draw a lower horizontal line for products on the right, since reactants store more energy.
Step 3 - Draw the curve
Draw a continuous curve starting from the reactants, rising to a peak above both levels, and falling to the products.
Step 4 - Mark the activation energy
Draw an arrow pointing vertically from the reactants' level up to the peak and label it activation energy.
Step 5 - Mark the overall energy change
Draw an arrow from the reactants' level down to the products' level and label it overall energy change.
Step 6 - Classify the reaction
Because the products are lower in energy than the reactants, energy has been transferred to the surroundings.
The reaction is exothermic.
Enthalpy change and its sign convention
The enthalpy change () is the energy change of a reaction, measured in kJ or kJ/mol.
The sign convention
- is negative for exothermic reactions - Energy is transferred to the surroundings, so the chemicals lose energy.
- is positive for endothermic reactions - Energy is taken in from the surroundings, so the chemicals gain energy.
| Reaction type | sign | Surroundings temperature |
|---|---|---|
| Exothermic | Negative (−) | Rises |
| Endothermic | Positive (+) | Falls |
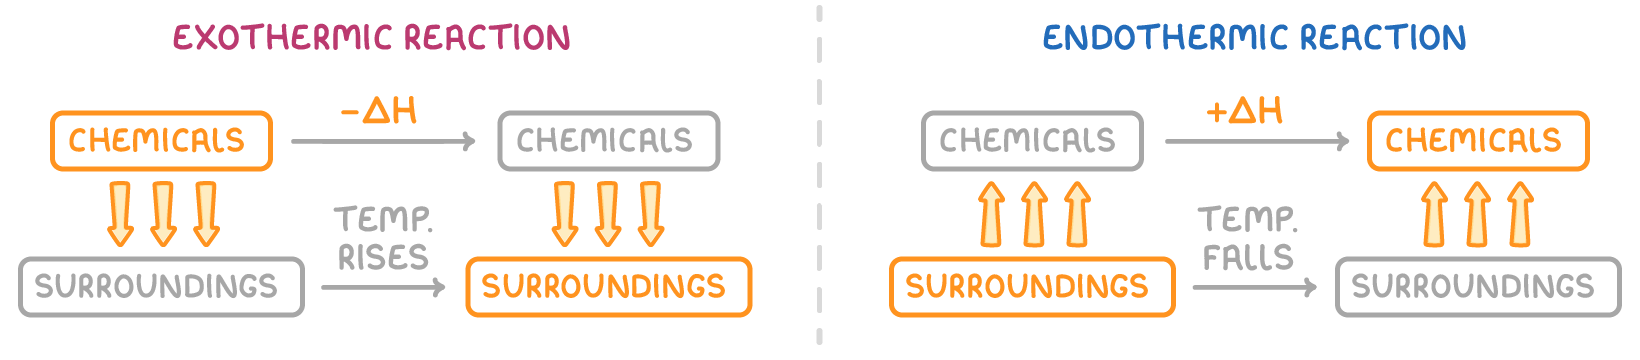
Orange marks where the energy is before and after the reaction.
Reading and labelling ΔH on a profile
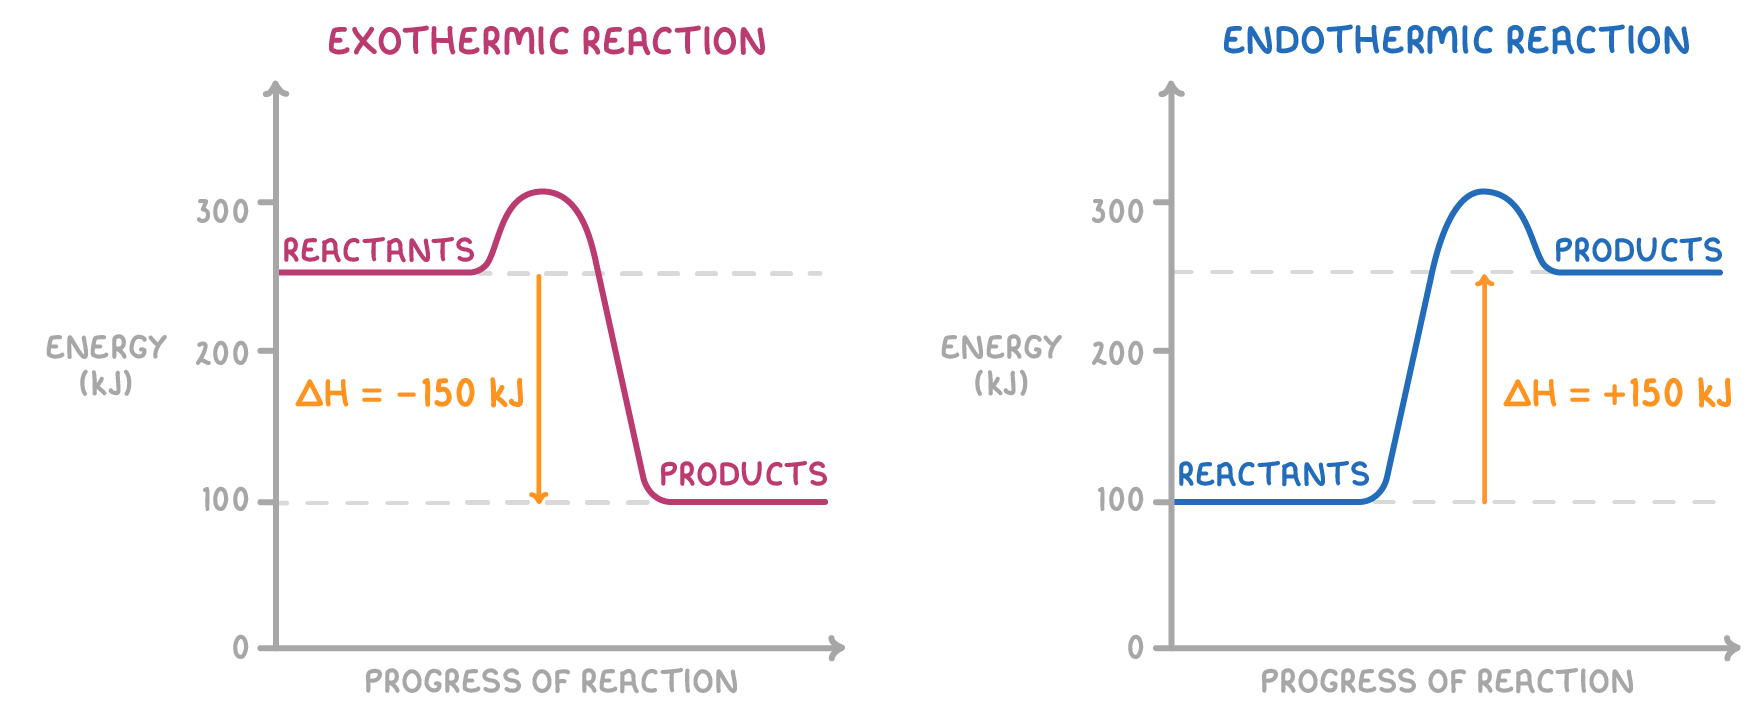
On a reaction profile, the enthalpy change () is the vertical gap between the reactants' level and the products' level.
Direction of the arrow
- Exothermic - The arrow points down from reactants to products ( is negative).
- Endothermic - The arrow points up from reactants to products ( is positive).
Calculating ΔH from a profile
-
Reactants at 250 kJ, products at 100 kJ:
-
Reactants at 100 kJ, products at 250 kJ: