13.4 - Plotting Graphs
Graph questions
In practical exams, you are often given a table of results and a blank grid to plot. Graph questions typically assess four marking criteria:
- Label both axes with the quantity and its unit.
- Choose a linear scale so the plotted points fill more than half the grid in both directions.
- Plot every point accurately, to within half a small square of its true value.
- Draw the correct line of best fit for the data.
The three line conventions
The mark scheme accepts three types of line depending on the chemistry involved:
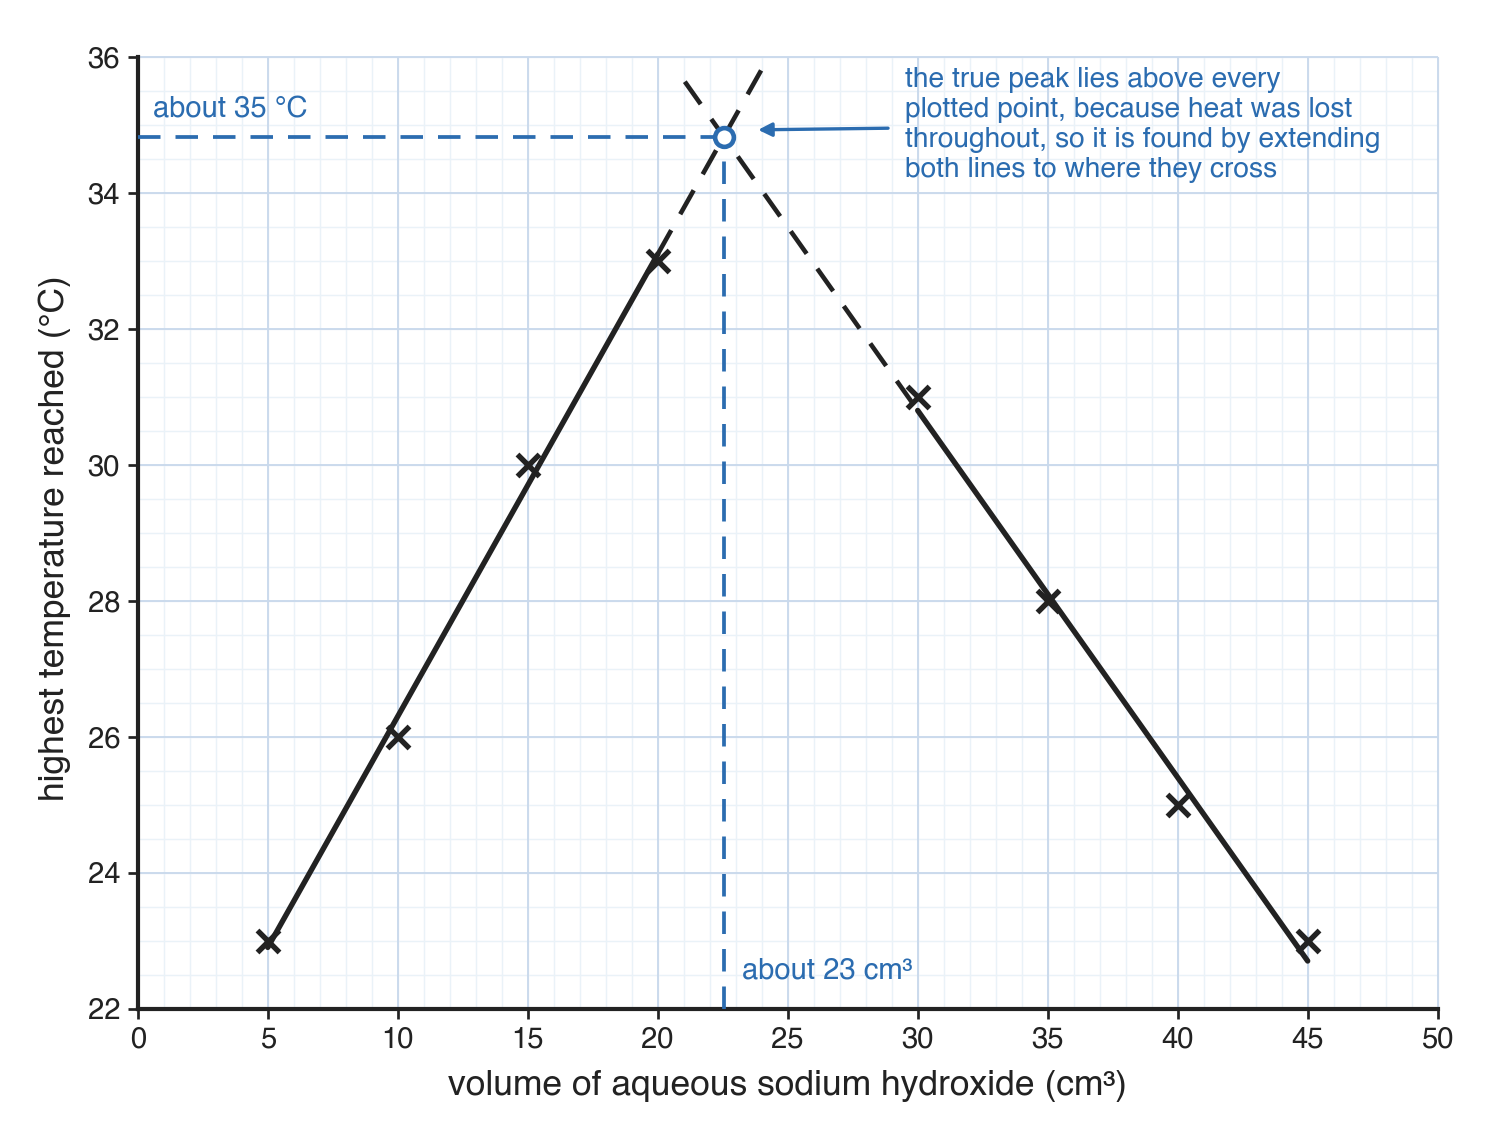
- Two straight lines extended to intersect - Used where the true end point or peak is found by extrapolation (e.g. the volume of solution needed for exact neutralisation).
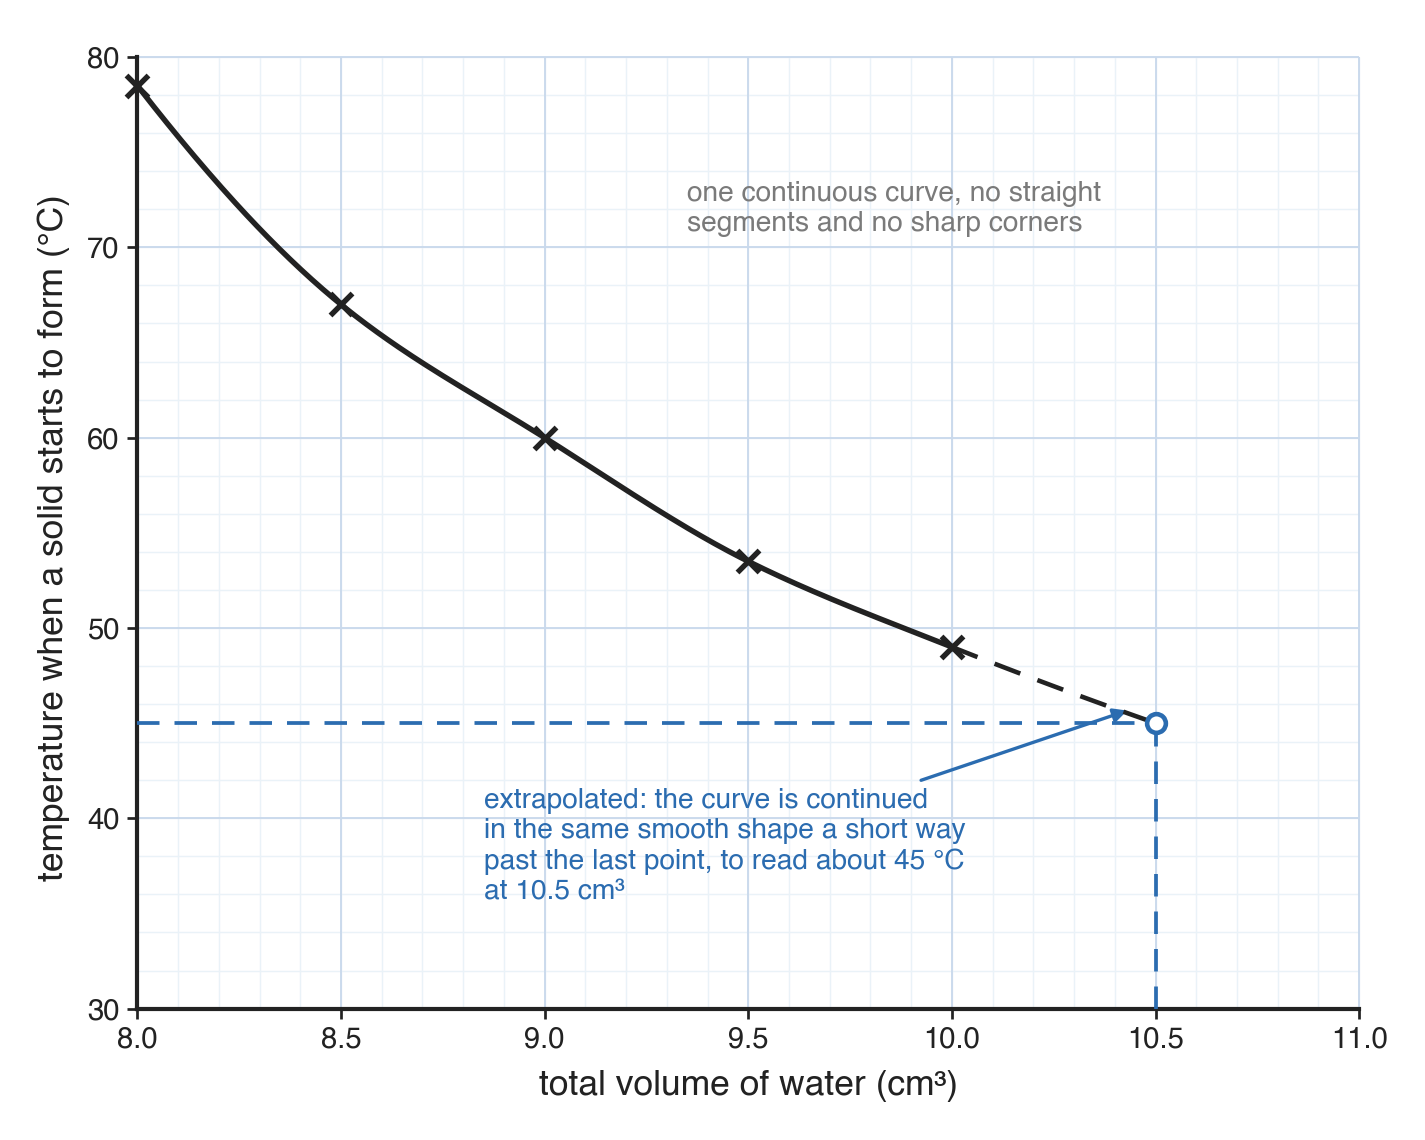
- A single smooth curve of best fit - Used where a quantity changes continuously or levels off (e.g. how solubility changes with temperature).
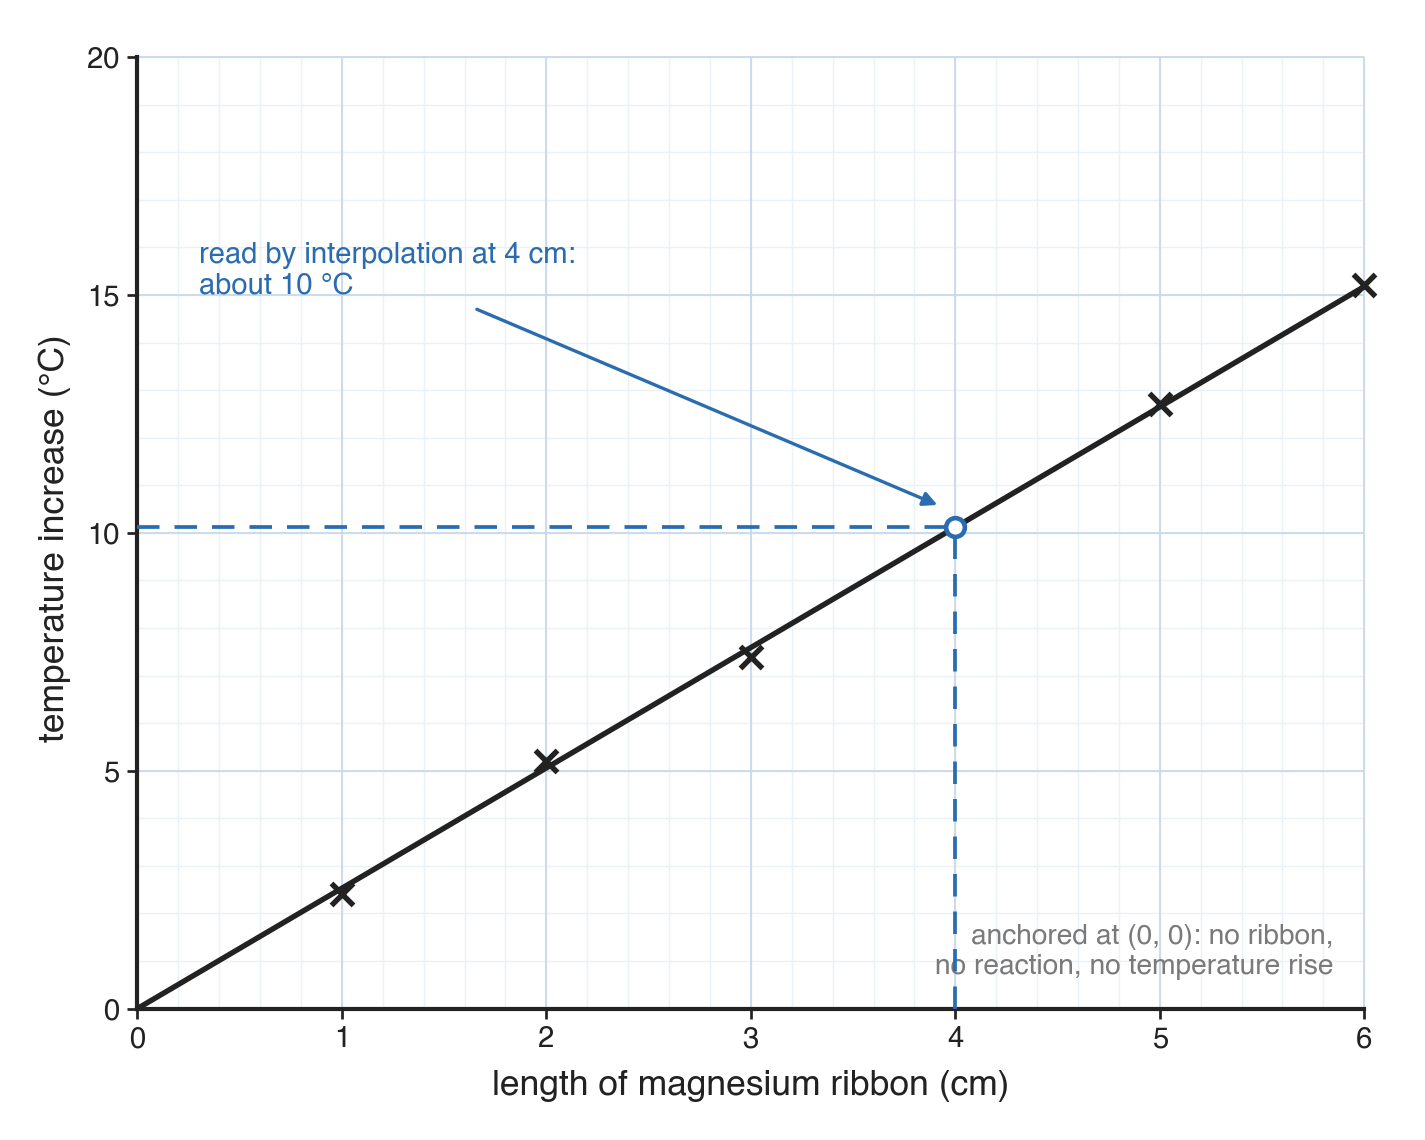
- A single straight line of best fit through the origin - Used where two quantities are directly proportional (e.g. the temperature rise from different lengths of reacting metal).
A typical question
Plot the results from Experiments 1 to 8 on the grid. [4]
Axes and scale
Labelling the axes
- Label each axis with the quantity and its unit, written like a table heading (e.g. volume of aqueous sodium hydroxide / cm3, temperature / °C).
- Unless the question specifies otherwise, the independent variable (what you changed) goes on the x-axis and the dependent variable (what you measured) goes on the y-axis.
A scale that fills the grid
- The scale must let the points fill more than half the grid in both directions.
- Use sensible intervals - each large square worth 1, 2, or 5 units (or 10, 20, 50), never awkward intervals such as 3 or 7.
- The scale must be linear, with equal steps for equal squares all the way along.
Plotting points
- Plot each reading as a small, sharp cross (or an encircled dot), never a large blob.
- Each point must be plotted to within half a small square on the grid.
Two straight lines extended to intersect
This method is used when the true value - such as the exact neutralisation point or the maximum theoretical temperature - lies beyond the recorded readings and must be found by extending two trends until they meet.
The shape of the data
- In a thermometric titration, a student adds increasing volumes of alkali to acid while keeping the total volume constant, recording the maximum temperature reached.
- As alkali is added, the temperature rises, peaks at exact neutralisation, and then falls as excess solution cools the mixture.
- Plotted points form two straight trends, rising then falling.
- Heat loss to the surroundings means the real maximum temperature sits above every plotted point.
Drawing the lines
- Rule a straight line through the rising points and a second straight line through the falling points.
- Extend both lines with a ruler until they cross.
- Draw construction lines from the crossing point down to the x-axis and across to the y-axis to read off the values.
A single smooth curve of best fit
A single curve is used where a quantity changes continuously and smoothly across the whole range, without a sudden change in trend.
The shape of the data
- In a solubility experiment, a student dissolves a fixed mass of solid in increasing volumes of water, heating until dissolved and recording the temperature at which crystals first reappear upon cooling.
- As more water is added, the crystallisation temperature falls steadily.
- Plotted points form a continuous downward trend that curves smoothly across the range.
Drawing the curve
- Draw one continuous curve in a single smooth stroke, passing through or close to every point, with no straight segments and no sharp corners.
- If a value is needed beyond the plotted range, extend the curve in the same smooth shape (extrapolation).
A single straight line through the origin
This method is used where two variables are directly proportional: doubling the independent variable doubles the dependent variable, and zero independent variable gives zero dependent variable.
The shape of the data
- When different lengths of magnesium ribbon react with excess dilute acid, a longer piece contains more reactant and releases proportionally more heat.
- With zero magnesium, there's zero reaction and zero temperature rise, meaning the line must start at (0,0).
- Plotted points lie along a straight trend starting from the origin.
Drawing the line
- Draw a single line with a ruler, passing as close as possible to all points.
- Ensure the line passes through the origin to within half a small square.
Common exam questions
Question 1
A graph of highest temperature against volume of sodium hydroxide added rises, peaks, and falls as more sodium hydroxide is used. What line should be drawn, and why?
Two straight lines, one through the rising points and one through the falling points, extended until they cross - the true neutralisation point lies above the highest plotted point, because heat is lost to the surroundings throughout, so it has to be found by extending both trends to where they meet rather than read from a single reading.
Question 2
A student investigates the solubility of a salt at several temperatures and the points curve smoothly across the whole range with no sudden change of direction. What kind of line should be drawn?
A single smooth curve of best fit through all the points, since the relationship changes continuously across the whole range rather than switching between two different trends.
Question 3
Why must a graph of temperature increase against length of magnesium ribbon pass through the origin?
Because with no magnesium ribbon present there is no reaction and so no temperature increase, meaning the value of the dependent variable must be zero when the independent variable is zero.
Question 4
A graph scored 2 of the 4 marks. The axes were labelled with units and the points were accurate crosses. Suggest what lost the other two marks.
The scale, if the points did not fill more than half the grid or the intervals were not a sensible ratio such as 1, 2, or 5 per large square; and the line, if it was the wrong kind of line for the data - a smooth curve drawn through points that actually needed two straight lines extended to a crossing point, for example.
Question 5
A student's two straight lines on a neutralisation graph do not reach far enough to cross on the grid. What should they have done?
Extended both ruled lines further with a ruler, past the last plotted point in each direction, until they actually cross - the crossing point usually lies beyond every plotted point, so the lines have to be drawn into that space rather than stopped where the data ends.
Question 6
One point on a graph of temperature increase against length of magnesium ribbon lies well off the otherwise straight trend through the origin. What should be done with it when the line is drawn?
Treat it as an anomalous result and ignore it, drawing the ruled line through the origin and the remaining points without bending the line to reach the odd one out.