5.3 - Calculating Rate from Graphs
Calculating mean rate from a graph
A rate-of-reaction graph plots the quantity of a reactant used up or product formed (y-axis) against time (x-axis).
Method
- Choose the two times between which you want the mean rate.
- Read the quantity plotted at each of the two times.
- Subtract the earlier reading from the later one to find the change in quantity.
- Subtract the earlier time from the later time to find the change in time.
- Divide the change in quantity by the change in time.
Formula for mean rate of reaction
To calculate the mean rate over the whole reaction, measure from the start (0 s) to where the line becomes flat (when the reaction has finished).
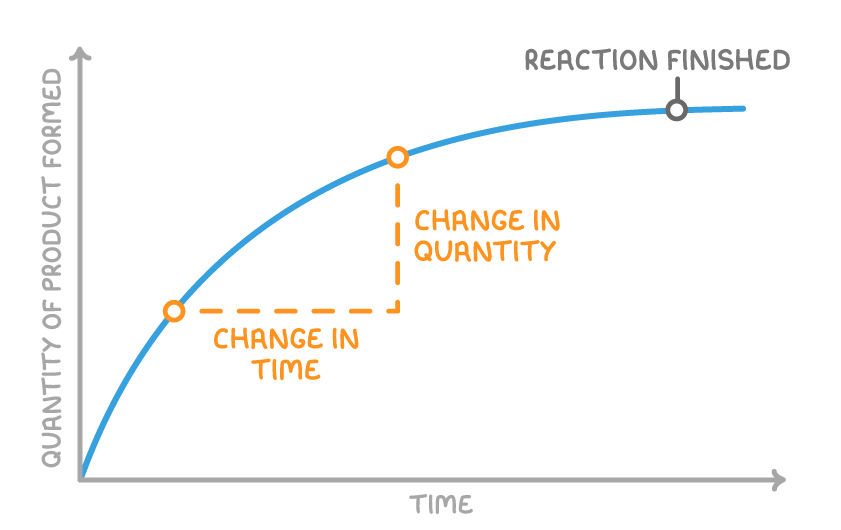
Worked example - Mean rate from a graph
The graph shows the volume of hydrogen gas produced when magnesium reacts with excess dilute hydrochloric acid. Calculate the mean rate of reaction between 20 s and 60 s.
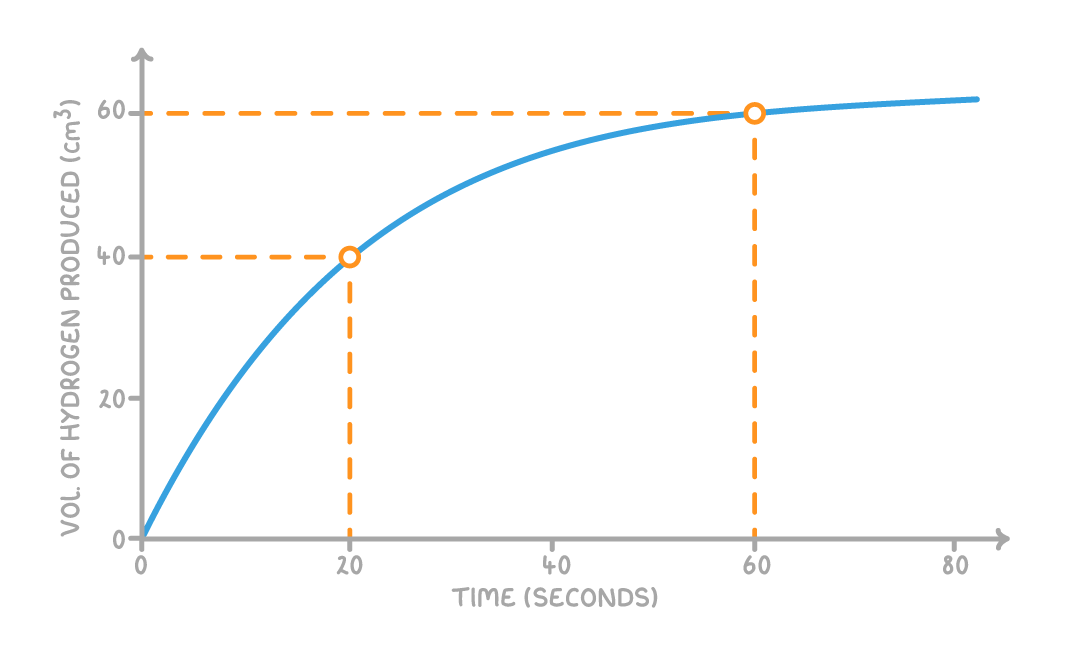
Step 1 - Read the quantity at each time
- Volume at 20 s = 40 cm3
- Volume at 60 s = 60 cm3
Step 2 - Find the change in quantity
60 cm3 - 40 cm3 = 20 cm3
Step 3 - Find the change in time
60 s - 20 s = 40 s
Step 4 - Divide change in quantity by change in time
Step 5 - Interpretation
- Over the first interval (0 s to 20 s), the volume rises from 0 cm3 to 40 cm3, giving a mean rate of .
- The reaction was four times as fast over the first interval as over the later one. Comparing mean rates over successive intervals shows how the rate falls as reactants are used up.
Finding the rate at one moment using a tangent
- The rate at a specific moment is the instantaneous rate.
- The instantaneous rate equals the gradient of a tangent drawn to the curve at that point.
Method
- Find the point on the curve at the chosen time.
- Draw a straight line that touches the curve at that point without crossing it (the tangent), extending it as far as space allows.
- Choose two points on the tangent as far apart as possible.
- Calculate the gradient by dividing the change in quantity by the change in time between those two points.
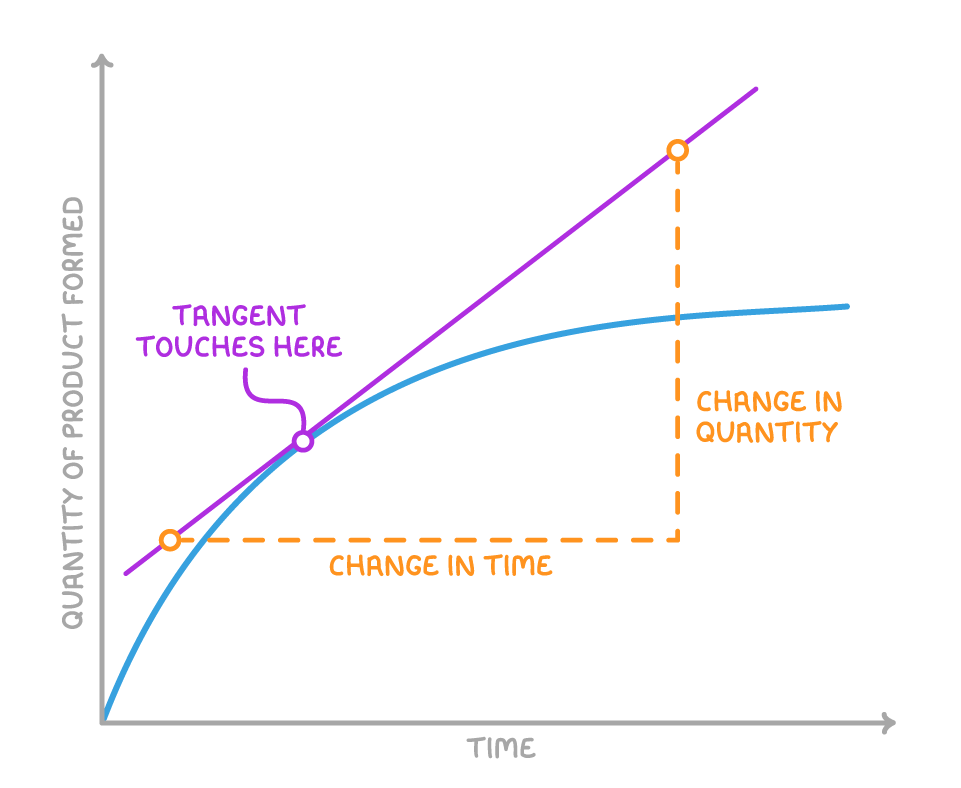
Formula for the rate at a point
Tangents are drawn by eye, so mark schemes accept a small range of answers.
Worked example - The tangent's gradient
The graph shows the volume of hydrogen gas produced when magnesium reacts with excess dilute hydrochloric acid. A tangent has been drawn to the curve at 20 s. Use the tangent to calculate the rate of reaction at 20 s.
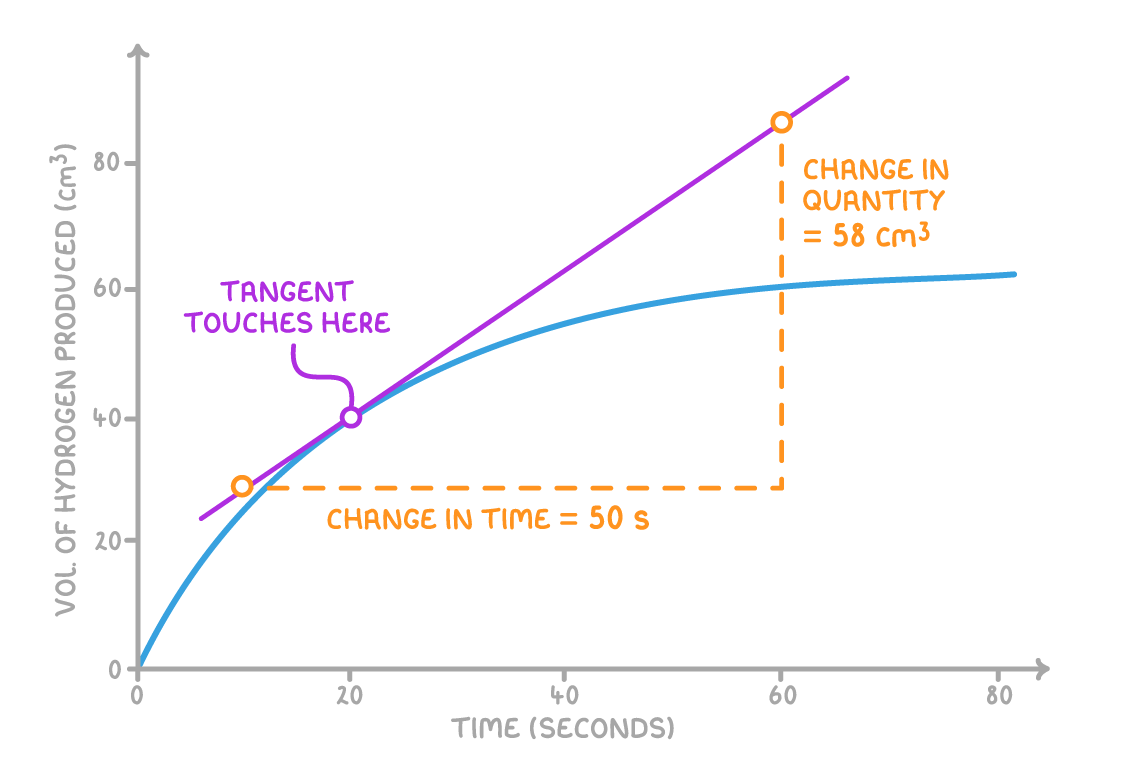
Step 1 - Read the values from the tangent
- Change in quantity between the two marked points = 58 cm3
- Change in time between the same two points = 50 s
Step 2 - Divide change in quantity by change in time
Step 3 - Interpretation
- This is higher than the mean rate over 20 s to 60 s on the same graph (0.5 cm3/s, worked out in the mean rate example), which fits the graph's shape.
- The reaction is fastest early on and slows as reactants are used up, so the instantaneous rate at the start of an interval is always higher than the mean rate across it.