7.4 - Exothermic & Endothermic Reactions
Exothermic and endothermic reactions
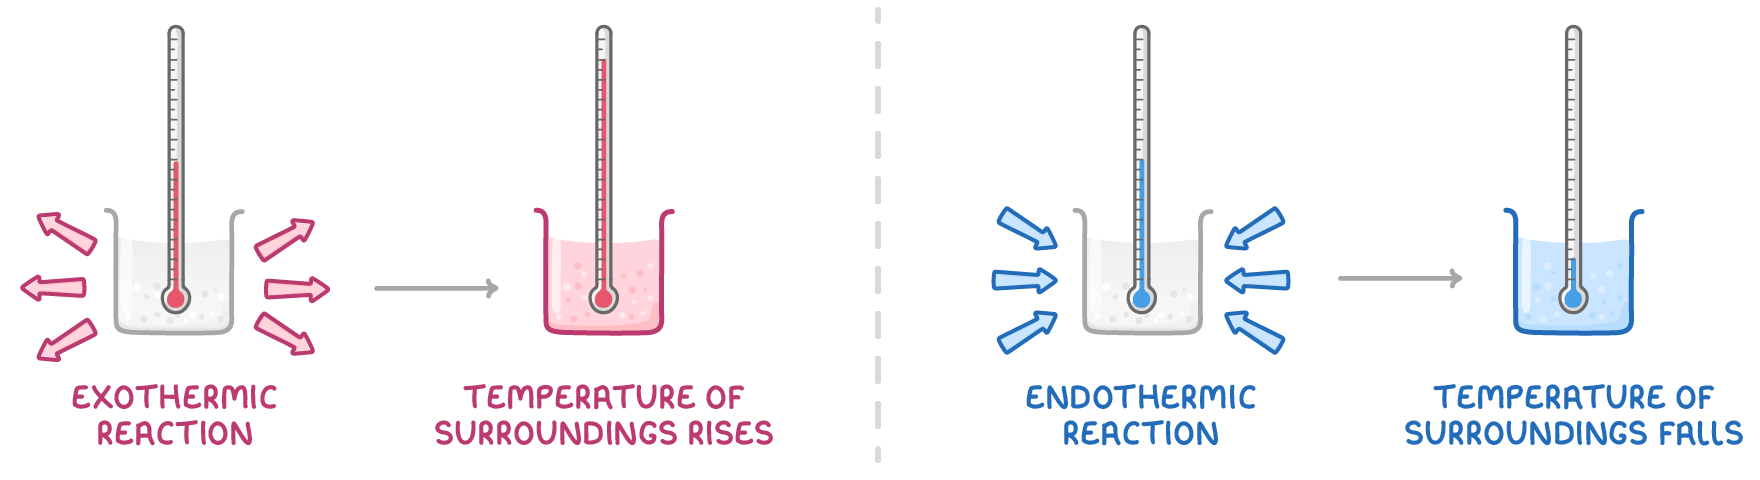
- In an exothermic reaction, energy is transferred to the surroundings, so the temperature of the surroundings rises.
- In an endothermic reaction, energy is taken in from the surroundings, so the temperature of the surroundings falls.
Energy is conserved
- Energy can't be created or destroyed, only transferred.
- In an exothermic reaction, the products hold less energy than the reactants because energy was released to the surroundings.
- In an endothermic reaction, the products hold more energy than the reactants because energy was taken in from the surroundings.
Sign of the energy change
- Negative (−) - Energy given out (exothermic).
- Positive (+) - Energy taken in (endothermic).
| Exothermic reaction | Endothermic reaction | |
|---|---|---|
| Energy is | transferred to the surroundings | taken in from the surroundings |
| Temperature of the surroundings | rises | falls |
| Compared with reactants, products | hold less energy | hold more energy |
Exothermic and endothermic examples
| Change | Direction | Example |
|---|---|---|
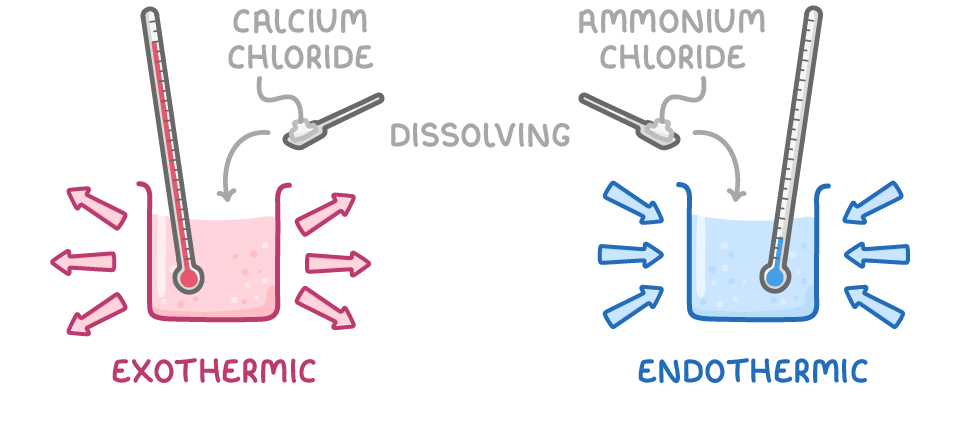
| Dissolving a salt | Either, depending on the salt | Ammonium chloride cools water (endothermic); calcium chloride warms it (exothermic) |
| Neutralisation | Exothermic (mostly) | Hydrochloric acid with sodium hydroxide (exothermic); ethanoic acid with sodium hydrogencarbonate (endothermic) |
| Displacement | Exothermic | Zinc powder reacting with copper sulfate solution |
| Precipitation | Exothermic | Lead(II) nitrate reacting with potassium iodide solution |
| Combustion | Exothermic | Burning fuels completely in oxygen |
Predicting the direction
- Displacement and precipitation are usually exothermic, and neutralisation almost always is.
- Dissolving can be exothermic or endothermic depending on the specific salt.
Reaction profiles
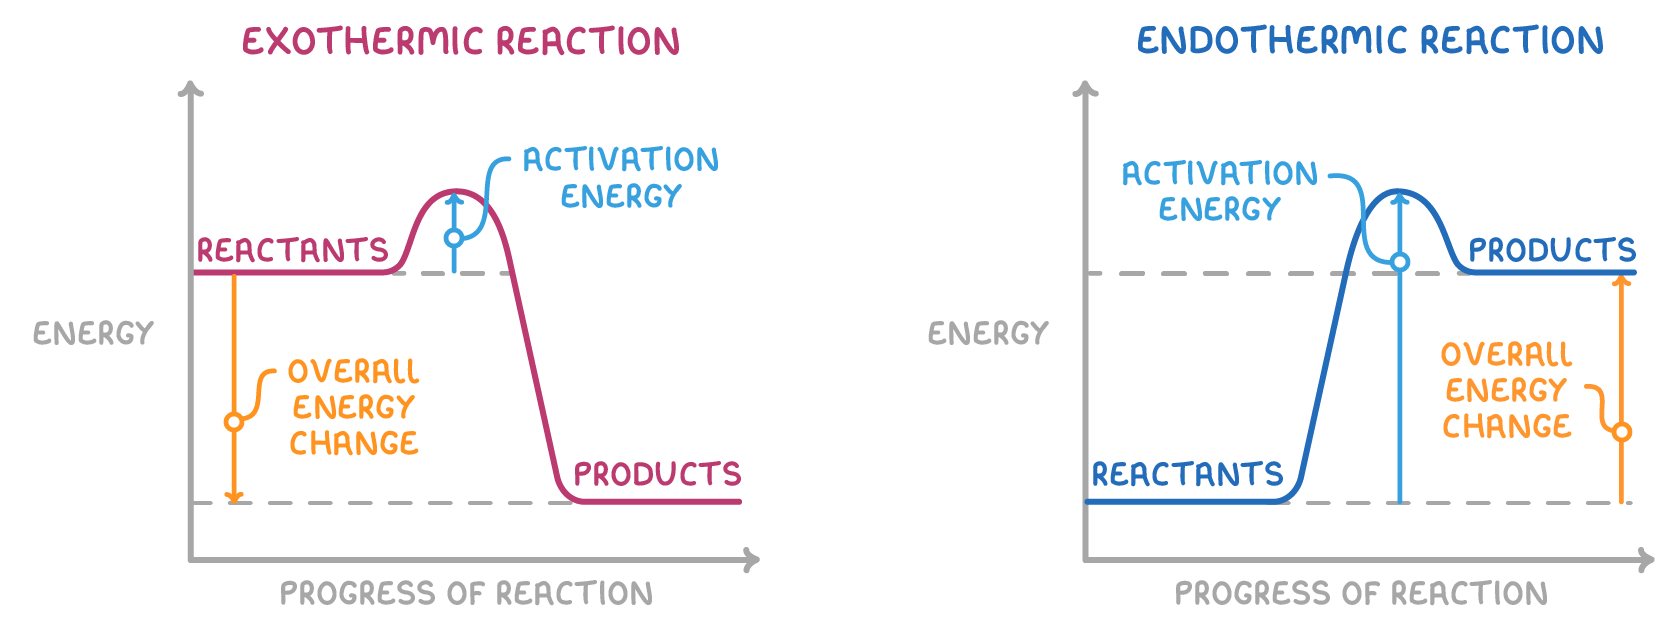
A reaction profile (or reaction pathway diagram) shows how the energy stored in the chemicals changes during a reaction.
The axes and levels
- Vertical axis - Energy stored in the chemicals.
- Horizontal axis - Progress of the reaction (from left to right).
- Reactants and products are drawn as horizontal lines.
Reading direction from the levels
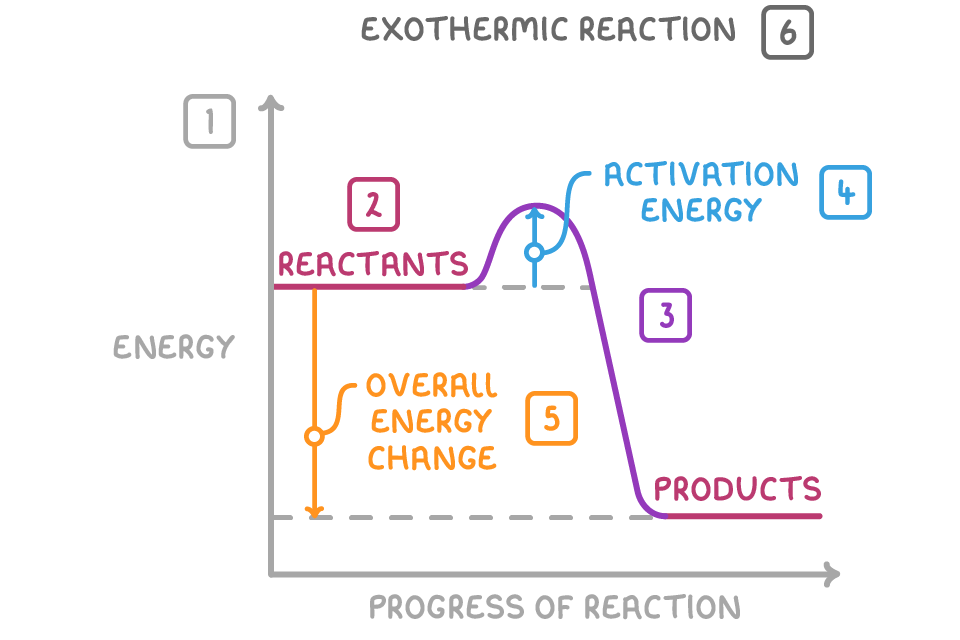
- Exothermic - The products are at a lower energy level than the reactants because energy is transferred to the surroundings.
- Endothermic - The products are at a higher energy level than the reactants because energy is taken in from the surroundings.
- The vertical gap between the reactants and products represents the overall energy change.
Activation energy on a profile
- The curve rises from the reactants to a peak before falling to the products.
- The activation energy is the height of the curve measured from the reactants' level to the top of the peak.
Drawing a fully labelled profile
- Axes - Energy on the vertical axis, progress of reaction on the horizontal axis.
- Levels - Reactants on the left, products on the right (products lower for exothermic, higher for endothermic).
- Curve - Starts at reactants, rises to a peak above both levels, then meets the products.
- Labels - An arrow from the reactants' level to the peak for activation energy, and an arrow between the reactants' and products' levels for the overall energy change.
Worked example - Drawing a reaction profile
A reaction is carried out in which the reactants store more energy than the products. Draw and label a reaction profile, marking the activation energy and the overall energy change, and state whether the reaction is exothermic or endothermic.
Step 1 - Draw and label the axes
Plot energy on the vertical axis and progress of the reaction on the horizontal axis.
Step 2 - Mark the reactant and product levels
Draw a horizontal line for reactants on the left. Draw a lower horizontal line for products on the right, since reactants store more energy.
Step 3 - Draw the curve
Draw a continuous curve starting from the reactants, rising to a peak above both levels, and falling to the products.
Step 4 - Mark the activation energy
Draw an arrow pointing vertically from the reactants' level up to the peak and label it activation energy.
Step 5 - Mark the overall energy change
Draw an arrow from the reactants' level down to the products' level and label it overall energy change.
Step 6 - Classify the reaction
Because the products are lower in energy than the reactants, energy has been transferred to the surroundings.
The reaction is exothermic.