9.5 - Reading & Interpreting Graphs
Reading information back out of a graph
Once a graph is drawn or printed on the paper, a common question type asks you to get information back out of it. There are two things it asks:
- Read a particular value off the line.
- Describe the trend the line shows.
A typical question
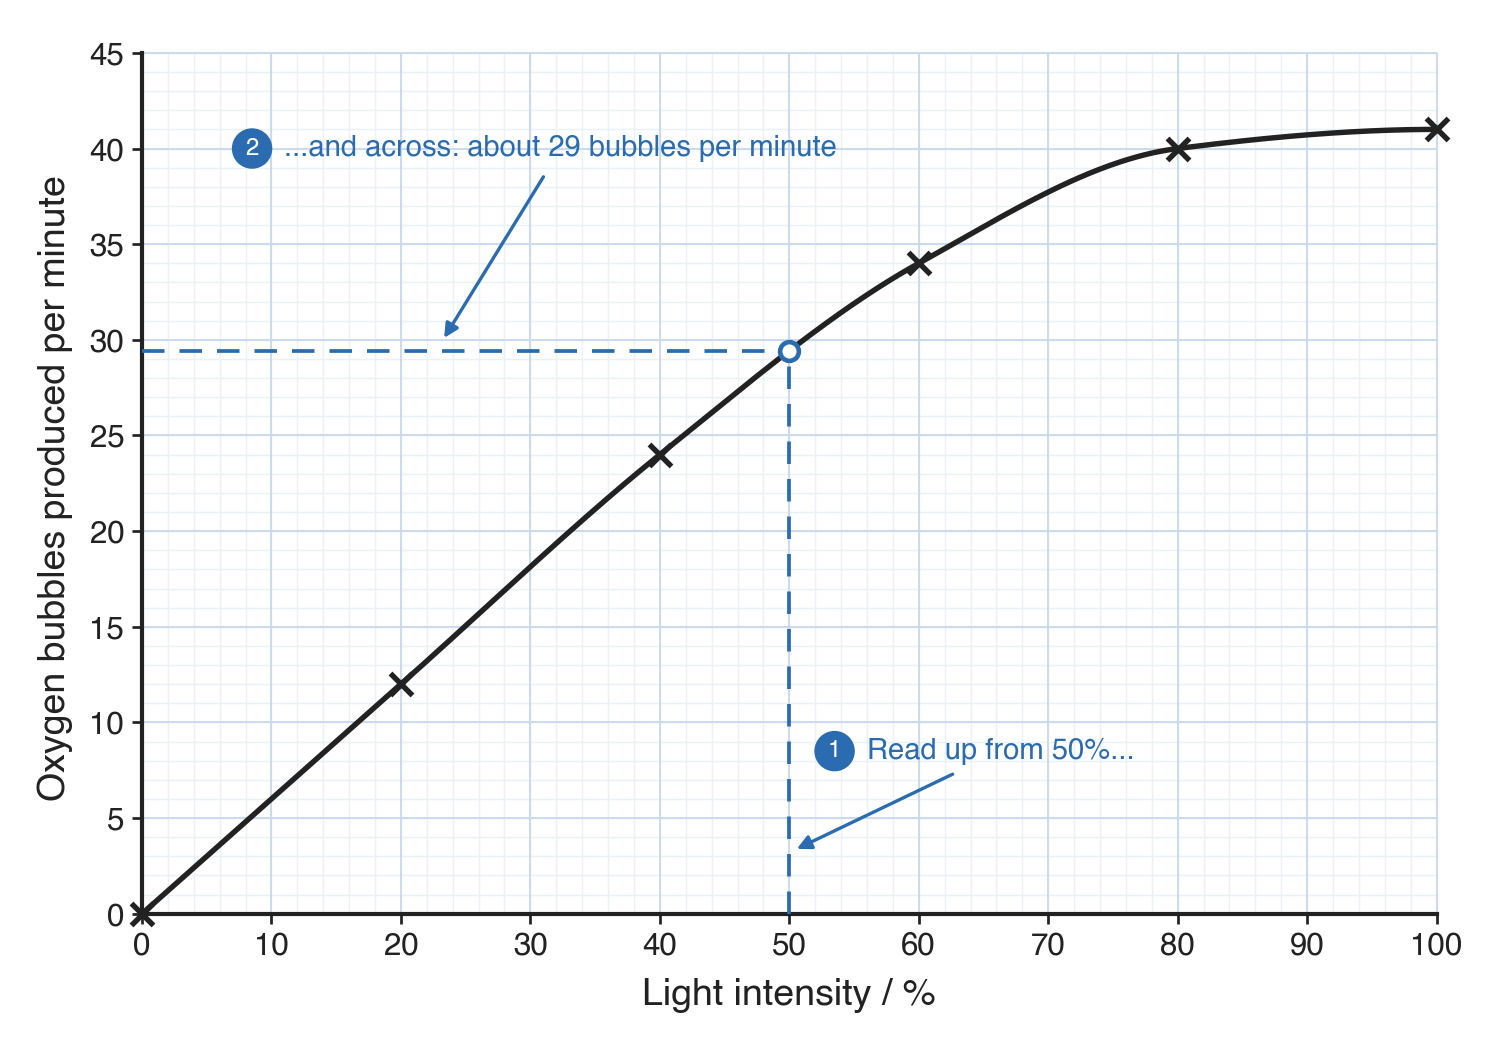
The graph shows how the rate of photosynthesis of some pondweed changes with light intensity.
(a) Use the graph to estimate the rate of photosynthesis at a light intensity of 50%.
(b) Describe the relationship between light intensity and the rate of photosynthesis.
Where the marks are
- (a) Read a value off the line that matches the graph, to within half a small square.
- (a) Draw construction lines on the graph showing where that reading came from.
- (b) Give the direction - e.g. as the light intensity increases, the rate increases.
- (b) Back it with figures from the axes, and say where the line levels off.
The construction lines in part (a) and the figures in part (b) are the marks most often missed - it's easy to write down a number or say "it goes up" and think the job is done.
Reading a value off a graph
- To read a value off a graph, go up from the x-axis value until you reach the line, then go across to the y-axis and read off the value.
- Example: to find the rate at a light intensity of 50%, go up from 50% to the line and across to the y-axis - giving about 29 bubbles per minute.
- Draw both dashed construction lines (up from the x-axis and across to the y-axis). The construction lines are part of the answer, not decoration - a number on its own, with no lines to show where it came from, can lose the mark.
Interpolation and extrapolation
- Interpolation - Reading a value between your plotted points. This is fine.
- Extrapolation - Reading a value beyond your last point. This is risky, so avoid it unless the question asks for it.
- Extrapolation is risky because you have no readings out there, so you're guessing that the line carries on the same way - when it might level off, drop, or bend.
Describing a trend
- A good trend answer needs three things:
- The direction the graph goes
- Some figures from the axes to back it up
- Any change in behaviour, such as where the line levels off or peaks
- Get all three in and the answer is complete - that's every mark the trend is worth.
A sentence frame keeps them in order
Use this frame to fit all three parts together:
As [the variable you changed] increases, [the variable you measured] increases / decreases, from [figure] to [figure], then levels off at [value].
For a photosynthesis graph, that reads:
"As the light intensity increases, the rate of photosynthesis increases, from 0 to about 40 bubbles per minute, then levels off at around 80%."
That one sentence carries the direction, the figures, and the change.
Finding a gradient
- You may be asked for the gradient of a straight section of the line.
- Pick two points that sit on the line, then divide the change in the y-value by the change in the x-value.
Formula for gradient:
Read both points off using construction lines, so the values you divide are ones that can be checked.
Common exam questions
Question 1
What is the difference between interpolation and extrapolation?
Interpolation is reading a value between your plotted points, which is fine; extrapolation is reading a value beyond your last point, which is risky.
Question 2
A table shows the average red blood cell count rising steadily with altitude up to 4,000 m. Using the information in the table, predict the count at 5,000 m.
Extend the pattern beyond the last reading: read the trend, then estimate a higher count than the 4,000 m value, in line with the steady rise. This is extrapolation, so it is only an estimate - the count could level off higher up.
Question 3
A graph shows the percentage vaccine uptake in a population over ten years. Describe the relationship between time and vaccine uptake.
Give the direction with figures and any change: for example, "as time increased, vaccine uptake increased, from about 20% to about 85%, then levelled off in the final years." Direction, figures, and where it levels off are all wanted.
Question 4
When may you describe a relationship as "proportional"?
Only when the line is straight and passes through the origin; using it for a curved or offset line can cancel an otherwise correct answer.
Question 5
How do you find the gradient of a straight section of a line?
Pick two points that lie on the line, then divide the change in the y-value by the change in the x-value, reading both points off with construction lines.
Selecting information from a passage or table
- Some questions give you everything you need in a passage, a table, or a set of data printed in front of you, and just ask you to find it.
- No calculation and no extra biology knowledge is needed - the fact is already there. The mark goes to whoever reads closely enough to spot it.
- These questions usually begin "Using information from the passage" or "Using the information in the passage".
- With a table, read across the row or down the column the question actually names - not the first figure that catches your eye.
Telling "select it" from "work it out"
- If the fact you need is written down somewhere in front of you, find it there rather than reasoning it out.
- If it is not written down, the passage is giving you context, not the answer - use your own biology knowledge instead.
- Example: a passage says Clostridium difficile "is a bacterium found in the gut that is usually harmless".
- Asked to identify the type of pathogen causing the diarrhoea, the answer - "a bacterium" - is picked straight out of that sentence, not worked out.
- A later part asking to suggest why each patient got the same number of capsules isn't in the passage - that answer (keeping the study valid by keeping that variable the same) is biology you already know.