9.4 - Plotting Graphs & Bar Charts
What a graph question looks like
- The N5 paper gives you a set of results in a table and asks you to plot them on a grid.
- The numbers are handed to you, so the marks are for a set of fixed, mechanical things you do the same way every time.
A typical question
A student measured the rate of photosynthesis of some pondweed at six different light intensities. The results are shown in the table.
Plot the student's results on the grid.
The four things you're judged on
- Label both axes with the quantity and its unit, written as "quantity / unit".
- Choose a linear scale so the plotted points fill a good part of the grid in both directions.
- Plot every point accurately, to within half a small square of its true value.
- Join the plotted points with a line, drawn with a ruler.
If the table has two sets of results to plot on the same grid, add a key that says which line is which.
Because these steps are the same on every graph, this is one of the most reliable sets of marks once you know what each one asks for.
Setting up a graph
Before you plot, decide two things: what type of graph to draw, and which variable goes on each axis.
Line graph or bar chart?
The rule is simple: use a bar chart for a discrete variable and a line graph for a continuous variable. Which type you draw depends on the variable you changed:
- Line graph - Draw one when the variable you changed is a continuous number, such as temperature, time, or light intensity. For example, the rate of photosynthesis at different light intensities is a line graph.
- Bar chart - Draw one when the variable you changed is discrete or categoric, meaning it comes in separate named groups such as species or blood group. For example, the rate of photosynthesis in four different species is a bar chart.
Which axis, and labelling the axes
- The variable you change goes along the bottom, on the x-axis.
- The variable you measure goes up the side, on the y-axis.
- That order never changes.
- Label each axis with the quantity and its unit, written as "quantity / unit" - for example, Light intensity / %. It's easy to lose marks by writing the quantity but forgetting the unit.
Choosing the scale and plotting the points
Once you know which graph to draw and how to label it, the next two steps are working out a scale and plotting the points.
A scale that fills the grid
- Use a linear scale where the data fills a good part of the grid - across as well as up. Work the scale out from your data rather than guessing.
- First, find the biggest value you need to fit on each axis (e.g. light intensity up to 100%, largest bubble count of 41 per minute).
- Then pick an interval that reaches near the top of the grid and is easy to plot - going up in 1s, 2s, 5s, or 10s per square.
- If one small square = 1 bubble, the data fills the grid nicely.
- If one small square = 3 bubbles, you can barely plot or read the values.
Plotting the points as crosses
- Plot each reading as a small, sharp cross, not a fat dot.
- Each point must be within half a small square of the true value.
- A blob hides exactly where the point is meant to be.
Worked example - Plotting a pondweed graph
A student counted the number of oxygen bubbles given off by pondweed each minute at different light intensities. Plot this data.
| Light intensity / % | Oxygen bubbles produced per minute |
|---|---|
| 0 | 0 |
| 20 | 12 |
| 40 | 24 |
| 60 | 34 |
| 80 | 40 |
| 100 | 41 |
Step 1 - Choose the graph type and axes
Light intensity is a continuous number, so this is a line graph. It was the variable that was changed, so it goes on the x-axis.
Step 2 - Work out each scale from the data
The x-axis needs to reach 100%, so one large square is worth 10%.
The y-axis needs to reach 41, so one large square is worth 5 bubbles.
Step 3 - Plot the points
Plot each reading as a small, sharp cross, keeping each within half a small square of its true value.
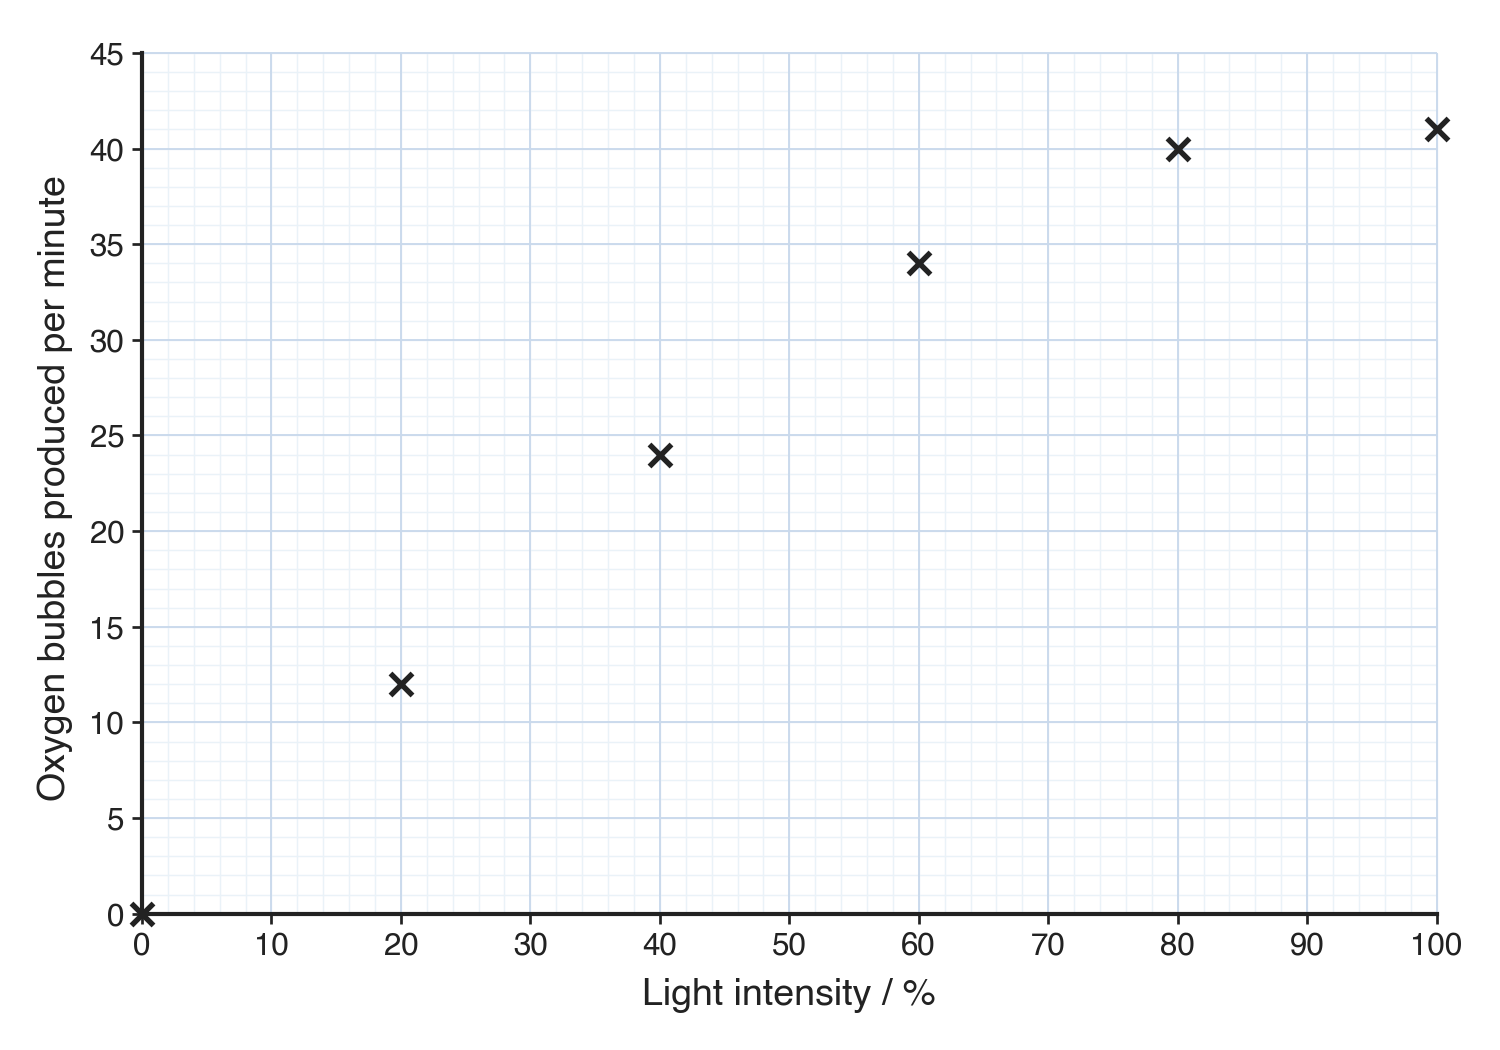
No line yet: the points are plotted first, and the line comes next.
Drawing the line
- Once the points are plotted, you draw a line to join them. National 5 marks this as "points plotted and line drawn" - so the line is part of the mark, and it's often dropped even when every point is in the right place.
- For a line graph, join the points one to the next with straight lines drawn with a ruler, so the line passes through every cross.
- National 5 does not ask for a line of best fit - you join the plotted points rather than drawing a single line through the middle of them.
- Anomalies are not left off the line here; identifying an anomaly is an evaluation skill.
Checking your graph with SPLAT
- Scale - It's linear, and the points fill a good part of the grid in both directions.
- Plot - Every point is a sharp cross, within half a small square of its true value.
- Line - The plotted points are joined with a line, drawn with a ruler.
- Axes - The variable you changed is across the bottom and the variable you measured is up the side.
- Titles - Both axes are labelled with the quantity and its unit, and there is a key if you plotted more than one set.
Common exam questions
Question 1
A table gives the average red blood cell count at five different altitudes, and asks you to complete the vertical axis and plot the data. Should you draw a line graph or a bar chart?
A line graph, because altitude is a continuous variable. Complete the vertical axis with a linear scale that lets the counts fill the grid, plot each point as a cross, and join the points with a ruled line.
Question 2
A student compares the rate of photosynthesis in five species of plant. Should the results be shown as a line graph or a bar chart?
A bar chart, because the variable changed (the species) is discrete rather than a continuous number.
Question 3
A student plotted every point in a line-graph question accurately but did not draw a line. Is the graph finished?
No. National 5 marks it as "points plotted and line drawn", so the points must be joined with a line; accurate points on their own do not complete that mark.
Question 4
A student's plotted points fill only about a third of the grid. Which mark is affected, and why?
The scale and label mark. If the graph uses less than half of the grid, that mark is not given, so the scale has to be chosen to make the data fill a good part of it.
Question 5
When does a graph need a key?
When you plot more than one set of data on the same grid, so the key can say which line is which.