22.4 - Plotting Graphs & Bar Charts
What a graph question looks like
- Every Cambridge practical paper hands you a set of results in a table and asks you to plot them on a grid.
- The examiner isn't marking whether the biology is right - the numbers are given to you. They're marking four fixed, mechanical things, each worth a mark.
A typical question
A student measured the rate of photosynthesis of some pondweed at six different light intensities. The results are shown in the table.
Plot the student's results on the grid. [4]
The four marks for plotting a graph
- Label both axes with the quantity and its unit, written as "quantity / unit" (1 mark).
- Choose a linear scale so the plotted points fill at least half the grid in both directions (1 mark).
- Plot every point accurately, to within half a small square of its true value (1 mark).
- Draw the line - A single smooth line of best fit, or the points joined with ruled straight lines (1 mark).
If the table has two sets of results to plot on the same grid, a fifth mark is added for a key saying which line is which (1 mark).
Why this is reliable marks
- Because these four things are the same on every paper, a graph is one of the most reliable sets of marks in the exam once you know exactly what each one asks for.
- Reading a value off the graph and describing the trend comes later, in the next subtopic.
Setting up a graph
Before plotting, decide two things: what type of graph to draw, and which variable goes on each axis.
Line graph or bar chart?
Which type you draw depends on the independent variable - the thing you changed in the experiment.
- Line graph - Draw one when both variables are continuous numbers, such as temperature, time, or light intensity. Rate of photosynthesis at different light intensities is a line graph.
- Bar chart - Draw one when the independent variable is categoric, meaning it comes in separate named groups such as species or blood group. Rate of photosynthesis in four different species is a bar chart.
Which axis, and labelling the axes
- The independent variable (the one you changed) goes on the x-axis along the bottom.
- The dependent variable (the one you measured) goes on the y-axis up the side.
- Label each axis with the quantity and its unit, written as "quantity / unit" - for example, Light intensity / %.
- This is worth a mark on its own, and it's an easy one to lose by writing the quantity but forgetting the unit.
Choosing the scale and plotting the points
Once you know which graph to draw and how to label it, the next two things the mark scheme checks are the scale and the plotted points.
A scale that fills the grid
- The mark scheme wants a linear scale where the data fills at least half the grid in both directions - across as well as up.
- Work the scale out from your data, don't guess it:
- First, find the biggest value you need to fit on each axis (e.g. light intensity goes up to 100%, and the largest number of bubbles is 41 per minute).
- Then pick an interval that reaches near the top of the grid and is easy to plot - going up in 1s, 2s, 5s, or 10s per square.
- If one small square is worth 1 bubble, the data fills the grid nicely; if one square is worth 3 bubbles, you can barely plot or read the values.
Plotting the points as crosses
- Plot each reading as a small, sharp cross, not as a fat dot.
- The mark scheme needs each point to be within half a small square of the true value.
- A blob hides exactly where the point is meant to be.
Worked example - Plotting a pondweed graph
A student counted the number of oxygen bubbles given off by pondweed each minute at different light intensities. Choose a suitable scale and plot the points.
| Light intensity / % | Oxygen bubbles produced per minute |
|---|---|
| 0 | 0 |
| 20 | 12 |
| 40 | 24 |
| 60 | 34 |
| 80 | 40 |
| 100 | 41 |
Step 1 - Choose the type of graph and the axes
- Light intensity is a continuous number, so this is a line graph.
- Light intensity was the variable that was changed, so it goes on the x-axis.
Step 2 - Work out each scale from the data
- The x-axis needs to reach 100%, so one large square is worth 10%.
- The y-axis needs to reach 41, so one large square is worth 5 bubbles.
Step 3 - Plot the points
Plot each reading as a sharp cross, within half a small square of its true value.
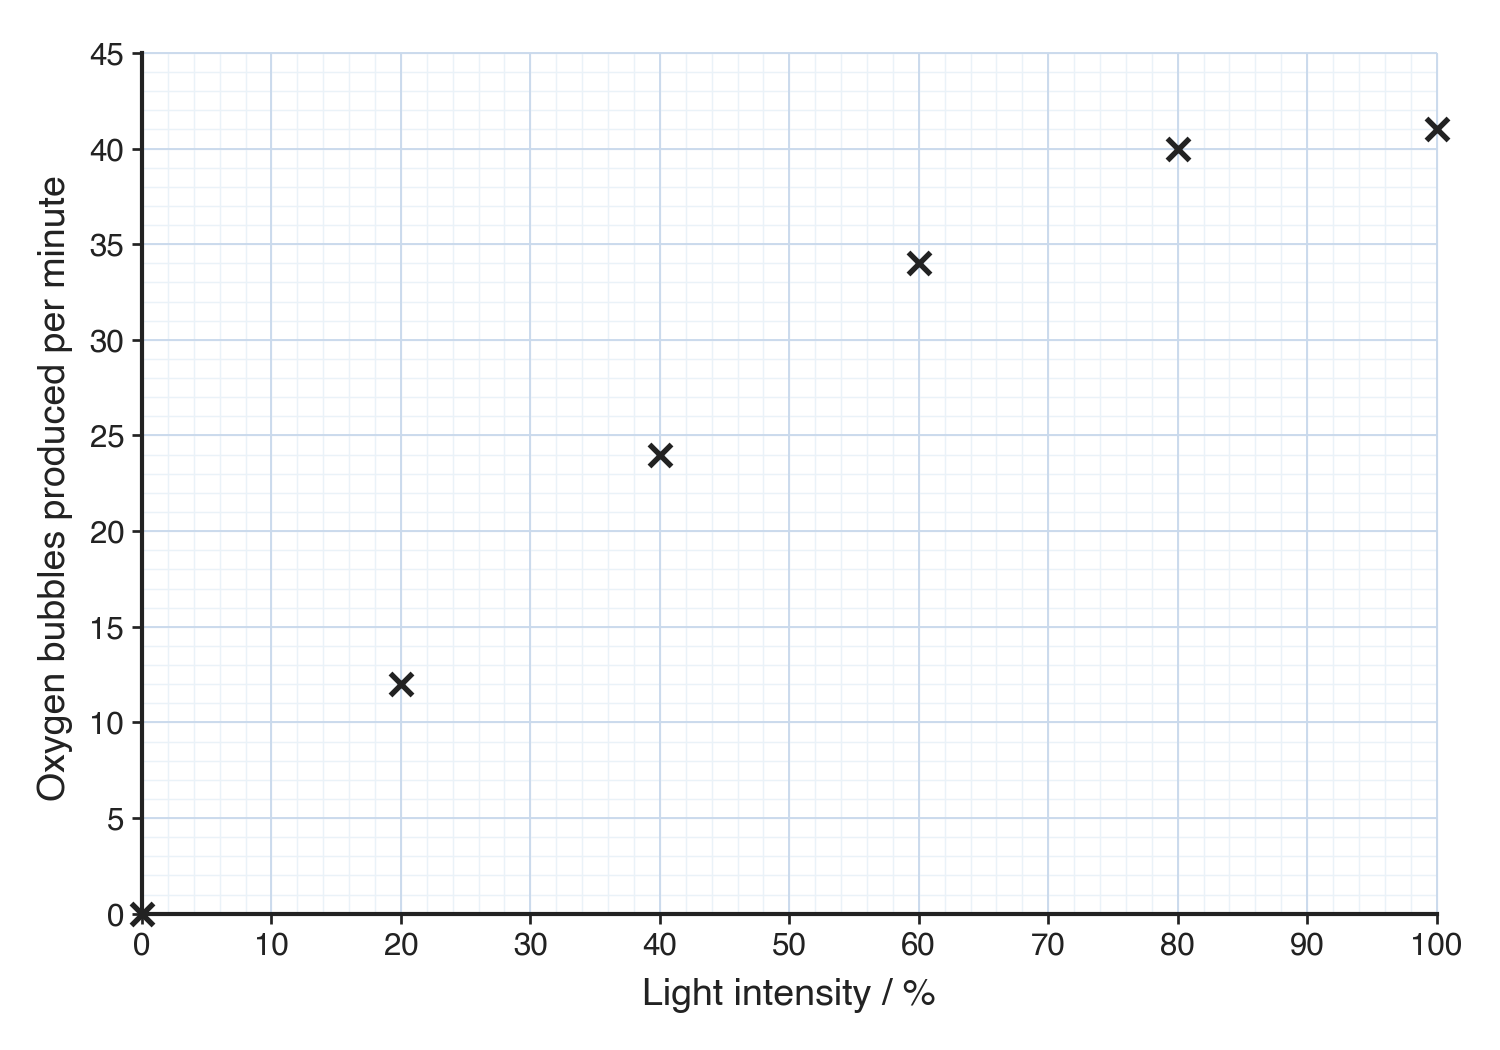
No line yet: the points are plotted first, and the line comes next.
Drawing the line
- The line is the last of the four plotting marks, and the one most often dropped even when every point is plotted correctly.
- Cambridge accepts two forms of line, so you have a choice between them.
The two accepted forms
- Line of best fit - A single thin line through the middle of the points, with roughly as many just above it as just below:
- Draw it with a ruler if the points lie on a straight line, or as a smooth curve if they follow one (as photosynthesis does when it levels off).
- It does not have to touch every point.
- If one point lies well off the trend, treat it as an anomaly and ignore it - don't bend the line to reach it.
- Point-to-point - The points joined with ruled straight lines from each cross to the next. Cambridge mark schemes accept this for the line mark too, as long as it's done neatly with a ruler.
If the question specifically asks for a line of best fit, draw the best-fit line rather than joining the points.
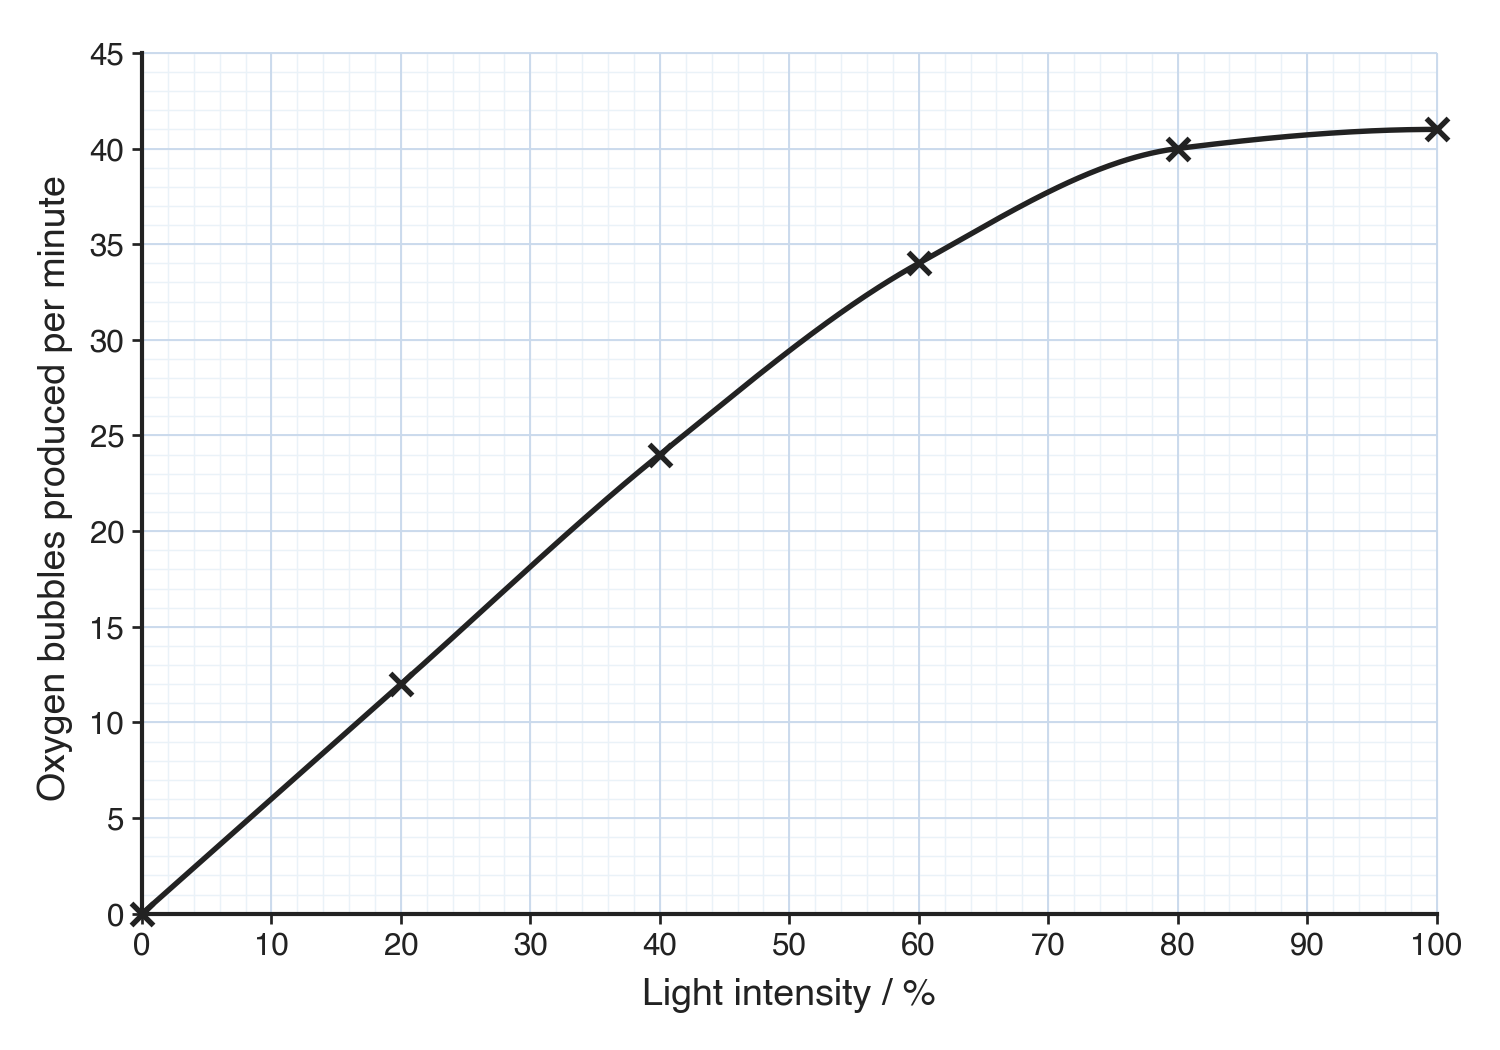
What loses the mark
- A freehand, wavering, or thick line.
- A line drawn nowhere near the points.
- A neat ruled line scores - whether a line of best fit or point-to-point - but a messy one does not, even when every point has been plotted perfectly.
Check your finished graph with SPLAT
- Scale - It's linear, and the points fill more than half the grid in both directions.
- Plot - Every point is a sharp cross, within half a small square of its true value.
- Line - One neat ruled line: a line of best fit, or the points joined point-to-point.
- Axes - The independent variable is across the bottom and the dependent variable is up the side.
- Titles - Both axes are labelled with the quantity and its unit, and there's a key if you plotted more than one set.
Common exam questions
Question 1
A student compares the rate of photosynthesis in five species of plant. Should the results be shown as a line graph or a bar chart?
They should be shown as a bar chart, because the independent variable (the species) is categoric rather than a continuous number.
Question 2
A student's graph scored 2 of the 4 marks. The axes were labelled with units and the points were accurate crosses. Suggest two things that lost the other two marks.
The scale was not even, or the points did not fill at least half of the grid; and the line was freehand or wavering rather than a neat ruled line of best fit or point-to-point join.
Question 3
One plotted point lies well off the trend. What should you do when you draw the line?
Treat it as an anomaly and ignore it, drawing the line through the other points without bending it to reach the odd one out.
Question 4
Why should you plot each point as a small cross rather than a filled dot?
A cross marks the exact position of the reading, so the examiner can check it is within half a small square of the true value; a large dot hides where the point actually is.
Question 5
When does a graph need a key, and what is it worth?
When you plot more than one set of data on the same grid; the key says which line is which and is worth an extra mark.