7.12 - Distribution Along a Transect
The experiment
Aim
To find out how the distribution of a species changes across a habitat where the conditions change from one side to the other (a gradient), using a transect.
Background
- A species is often found more in one part of a habitat than another, because conditions such as light or soil moisture change across it. Where it's found is its distribution.
- You can't see the distribution of a species all at once, but you can sample it at set points along a line.
- A transect is a line laid across the habitat. A quadrat is placed at fixed intervals along it, and the species is counted or its percentage cover estimated in each one.
- So in this practical you record a species in quadrats along a transect, and plot it against distance to show how its distribution changes across the habitat.
Variables
- Independent variable - The distance along the transect, in metres.
- Dependent variable - The number, or percentage cover, of the species in each quadrat.
- Control variables - The quadrat size, sampling in a single session, the same observer, and one measure throughout (either count or percentage cover, not a mix).
Method
- Lay the tape - Lay a tape measure in a straight line across the habitat, running along the gradient, for example from shade into open ground.
- Place the first quadrat - Put a quadrat at the start of the line (0 m), and record the number, or percentage cover, of each species you're studying.
- Move along the tape - Place the quadrat at fixed intervals, say every 2 m, and record each time.
- Measure the conditions - At each point, you can also measure the condition that changes, such as the light level or the soil moisture.
- Plot the results - Plot each species against distance to show how its distribution changes along the gradient.
Safety
- Working outdoors - Wear suitable footwear and sun protection, and take care not to trip over the tape.
- Soil and plants - Wash your hands after touching them and before you eat.
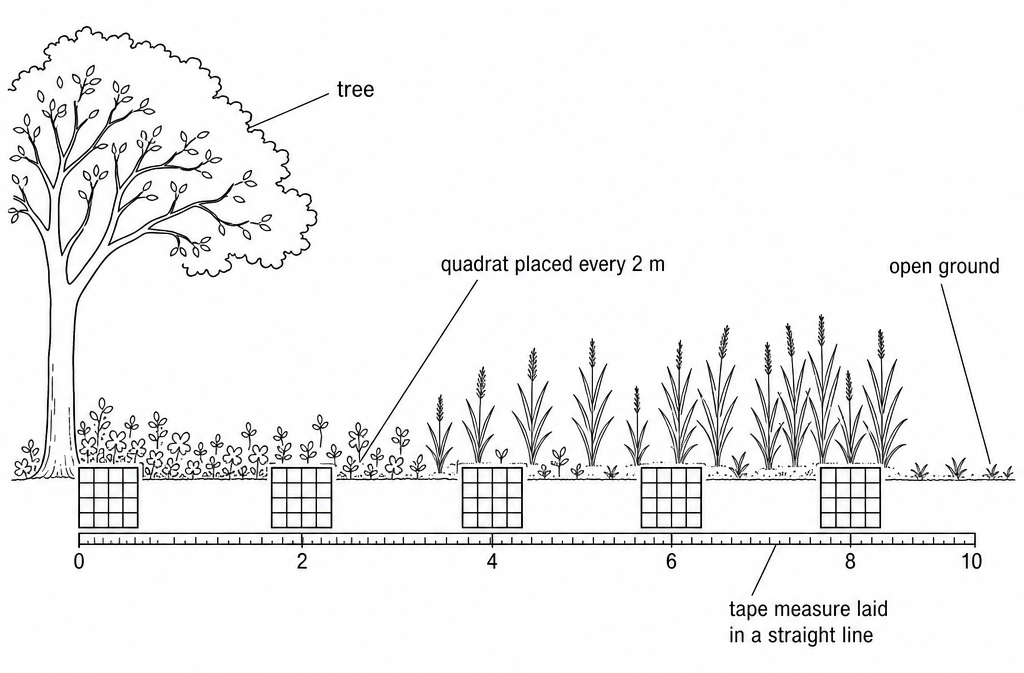
A transect is not random: the line is placed deliberately across the gradient.
Worked example - Distribution along a transect
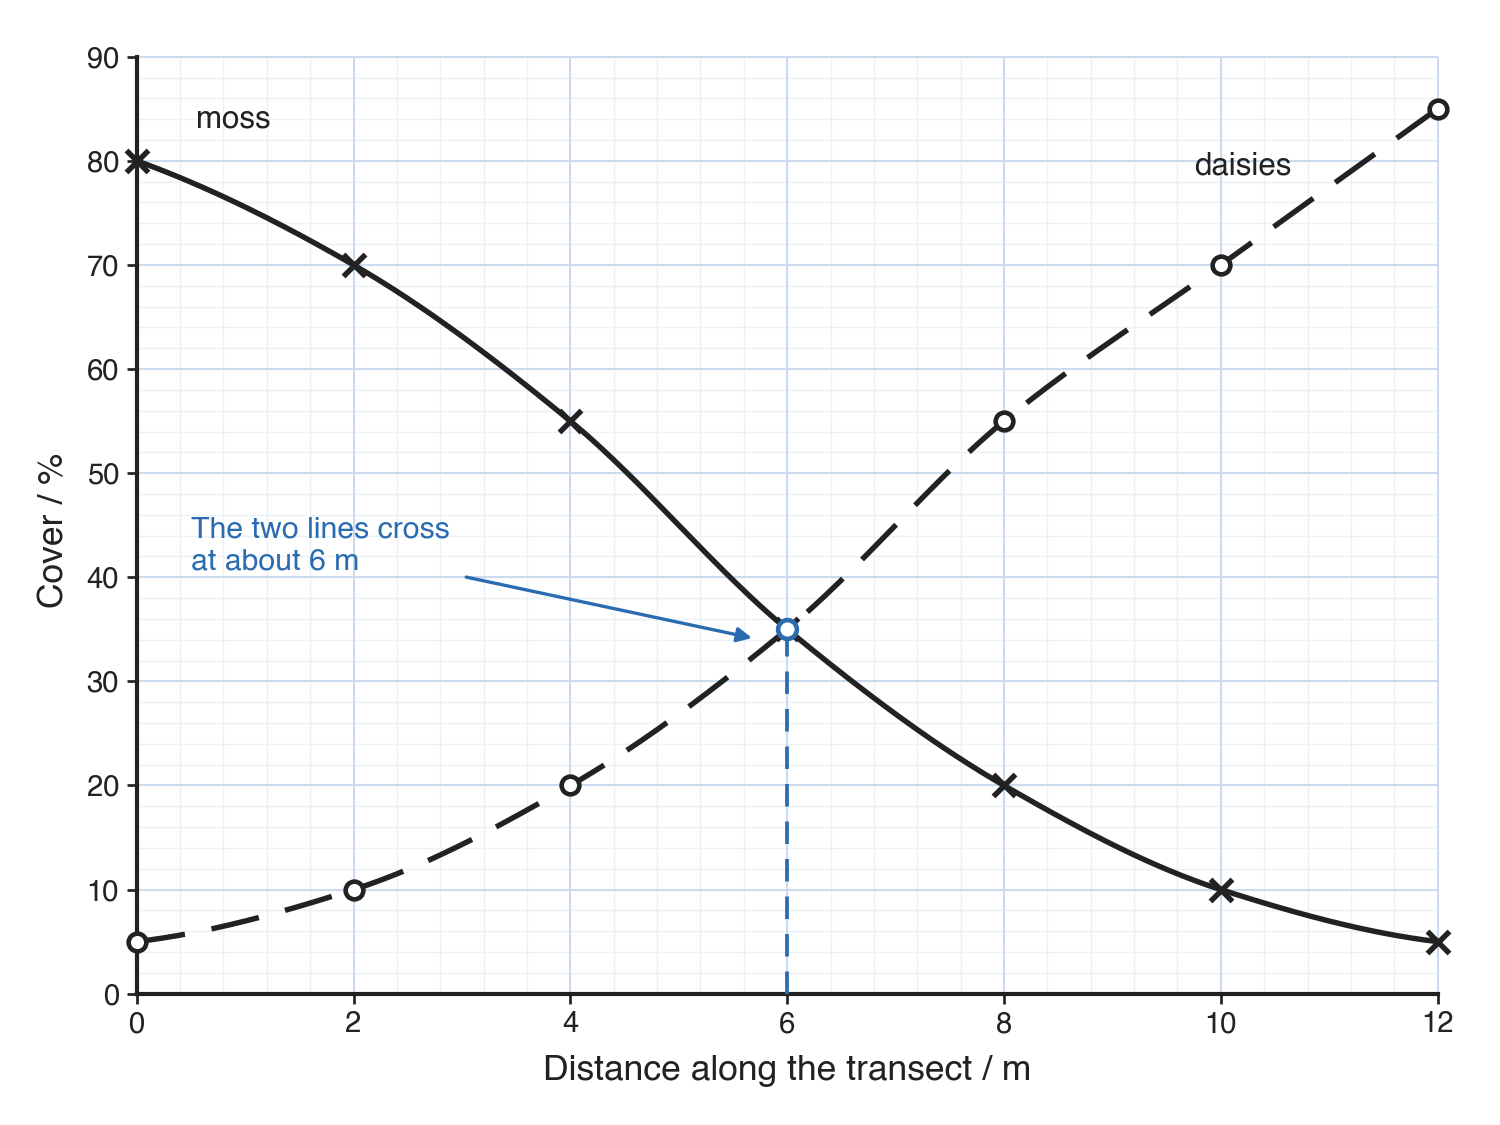
A student ran a transect from the shade of a tree out into open ground. They recorded the percentage cover of moss and of daisies in a quadrat every 2 m.
| Distance (m) | 0 | 2 | 4 | 6 | 8 | 10 | 12 |
|---|---|---|---|---|---|---|---|
| Moss cover (%) | 80 | 70 | 55 | 35 | 20 | 10 | 5 |
| Daisy cover (%) | 5 | 10 | 20 | 35 | 55 | 70 | 85 |
Plot the results, describe what each species does, and explain the pattern.
Step 1 - Plot the graph
Put distance along the transect on the x-axis and percentage cover on the y-axis. Draw one line for each species, one for moss and one for daisies.
Step 2 - Describe what each species does
Moss starts high in the shade, at 80% at 0 m, and falls steadily towards the open ground, to 5% at 12 m. Daisies do the opposite, rising from 5% at 0 m to 85% at 12 m.
Step 3 - Explain the pattern
Moss is suited to shade and damp, so it's most common near the tree. Daisies need more light, so they take over in the open. The two lines cross at about 6 m, where conditions stop favouring the moss and start favouring the daisies.
Common exam questions
Question 1
Why are the quadrats placed at fixed intervals along a transect rather than at random positions?
A transect is meant to show how the species changes along a gradient, so the quadrats have to follow the line at set distances. Random positions wouldn't show the change with distance.
Question 2
Why might the student also measure the light level at each point?
To see whether the change in the species matches the change in conditions, which gives a likely reason for the distribution.
Question 3
Give one way to make the results more reliable.
Run more than one transect across the habitat and compare them, so the pattern is less affected by one unusual line. "Be more careful" wouldn't be accepted.