9.4 - Reading Graphs & Drawing Conclusions
Reading a value off the graph
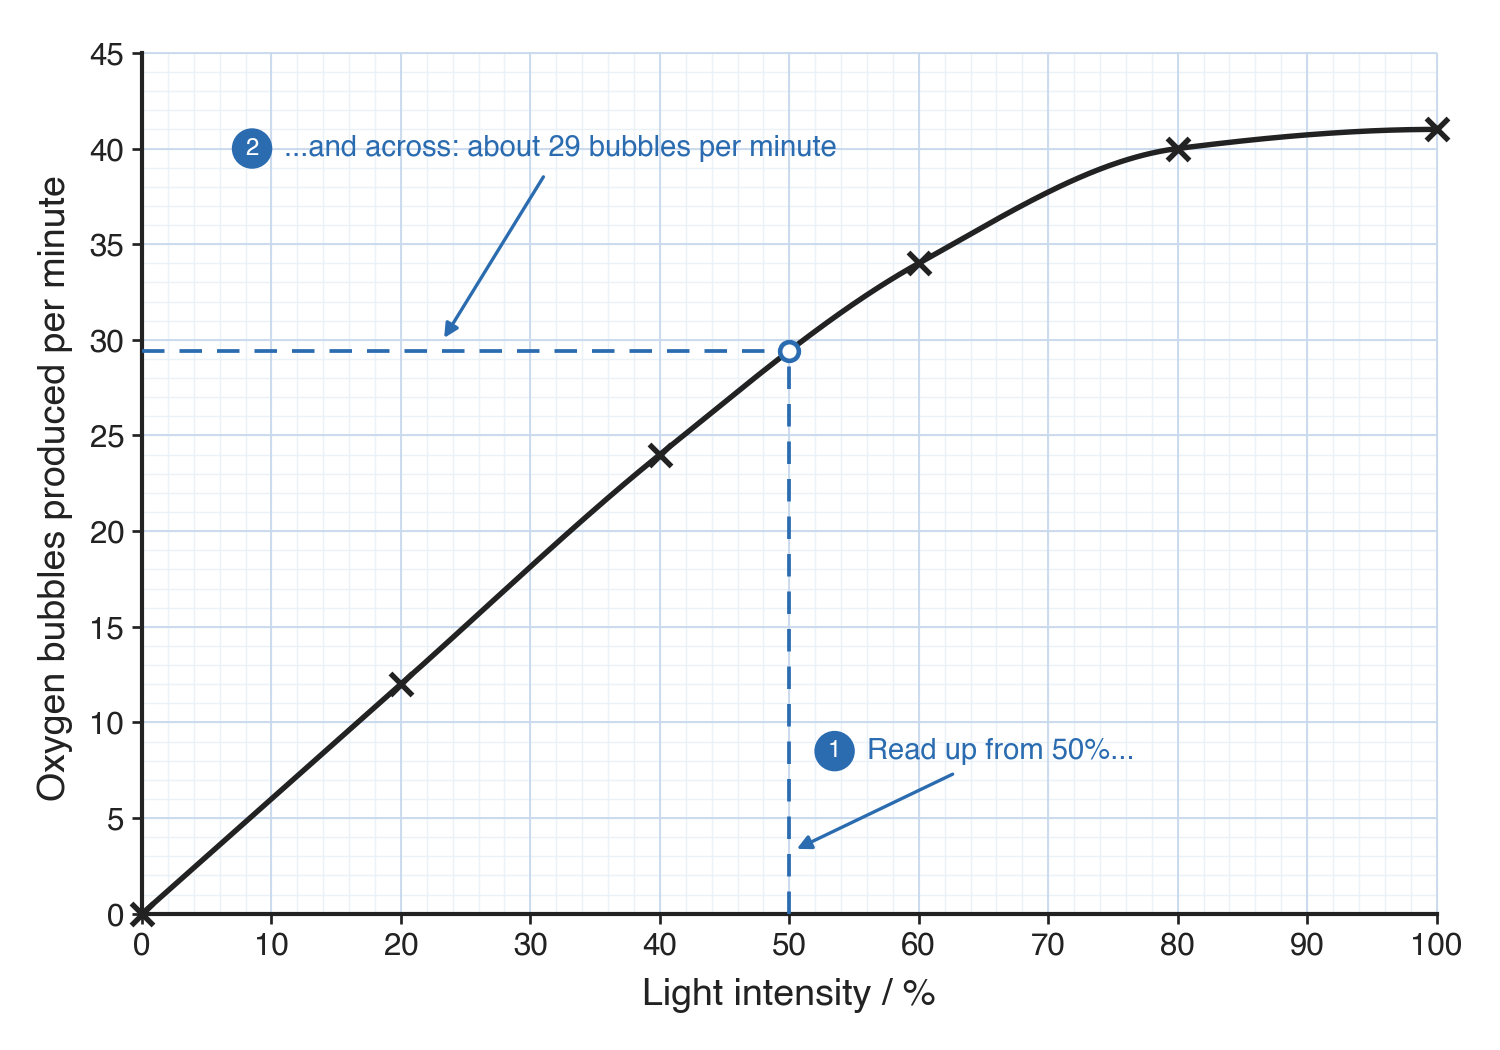
- To read the rate at a light intensity of 50%: go up from 50% on the x-axis to the line, then across to the y-axis and read off the value.
- Draw both dashed construction lines. A number on its own, with no lines to show where it came from, can lose the mark - the examiner can't see how you got it.
- Reading from a graph like this gives, for example, about 29 bubbles per minute at 50% light intensity.
Interpolation vs extrapolation
- Interpolation - Reading a value between your plotted points. This is fine.
- Extrapolation - Reading a value beyond your last point. This is risky, so avoid it unless the question asks.
- Out there you have no readings, so you're guessing the line carries on the same way - when it might level off, drop, or bend.
Describing a trend
A good trend answer needs three things:
- The direction the graph goes (increases or decreases)
- Some figures from the axes to back it up
- Any change, such as where the line levels off
A sentence frame keeps the parts in order
Use this structure to include all three parts:
As [the independent variable] increases, [the dependent variable] increases / decreases, from [figure] to [figure], then levels off at [value].
Worked into a photosynthesis graph: "As the light intensity increases, the rate increases, from 0 to about 40 bubbles per minute, then levels off at around 80%."
Finding a gradient
For the gradient of a straight section, pick two points on the line and divide the change in y by the change in x:
Drawing a conclusion
- A conclusion answers the question the experiment asked: how does the thing you changed affect the thing you measured.
- It always names both variables and says which way they move together:
As the [independent variable] increased, the [dependent variable] increased (or decreased).
Example (photosynthesis): "as the light intensity increased, the rate of photosynthesis increased".
Match the conclusion to the data
- A conclusion must match what the data actually shows - no more, no less.
- If you tested light intensities from 0 to 100%, you can only conclude the rate increased over the range you tested. Do not extend the pattern to values you never tried - you've no readings there.
What a conclusion is not
- Not a single reading - "the number of bubbles went up" names only the thing you measured, never the light intensity, so it doesn't link the two variables and won't score.
- Not a read-off - A read-off question wants a number; a conclusion question wants the relationship.
- Not an explanation - The conclusion says what happened (the rate increased as light intensity increased). Saying why (more light energy drives photosynthesis faster) is an explanation, and a "conclude" or "describe" question doesn't want it.
TermDefinition
InterpolationReading a value from a graph between the plotted points.
ExtrapolationReading a value from a graph beyond the range of the plotted points, by extending the line.
Key points to remember
How were these notes?