8.7 - Field Sampling with Quadrats
The technique
Aim
To estimate the size of a population (the total number of one species) in a habitat, using random sampling with quadrats.
Background
- A population is all the organisms of one species living in a habitat.
- You usually can't count every one, but you can count them in small squares of known area, called quadrats, and scale the result up to the whole habitat.
- So in this practical you count one species in quadrats placed at random, find the mean number per quadrat, and use it to estimate the population of the whole habitat.
Method
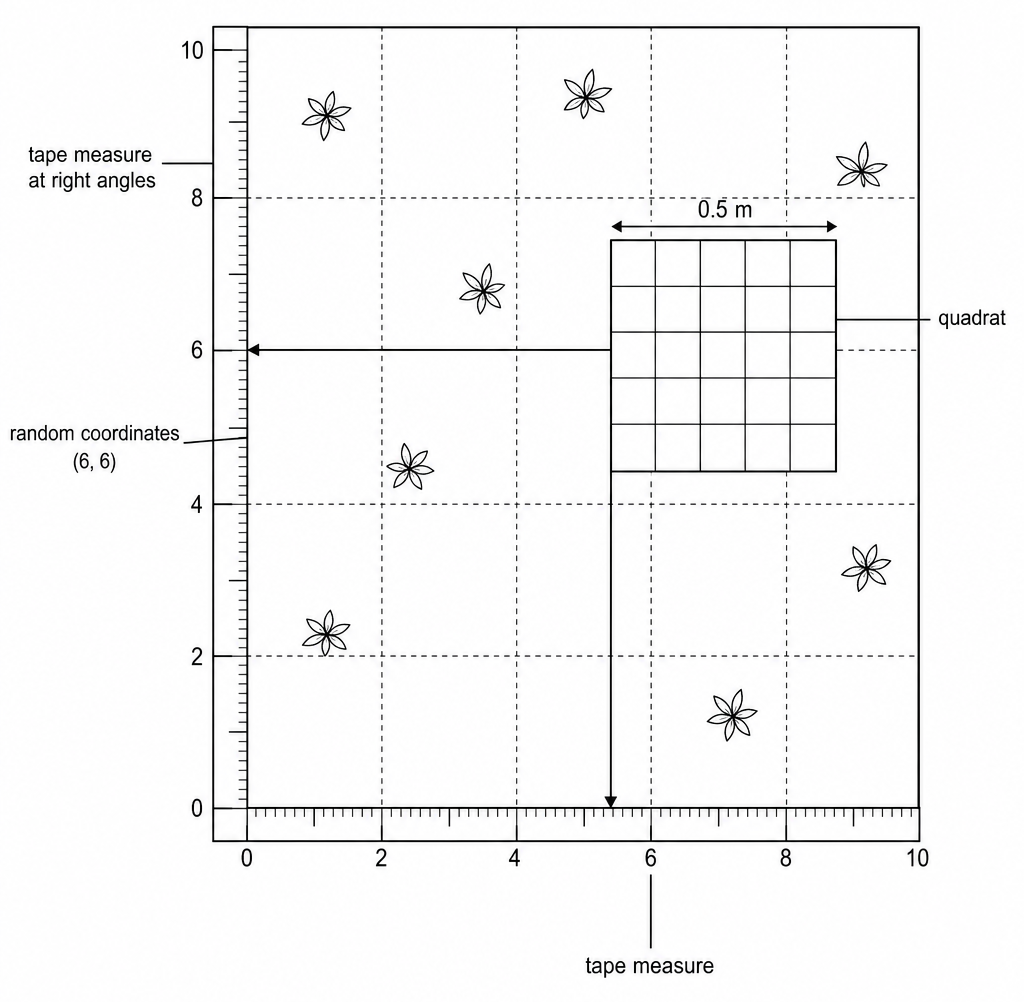
- Make a grid - Lay two tape measures at right angles to make a numbered grid across the habitat.
- Place the quadrat at random - Use a random number generator to pick a pair of coordinates, and place the quadrat there. A quadrat is usually 0.5 m × 0.5 m, which is 0.25 m2.
- Count the species - Count the number of your species inside the quadrat, or estimate the percentage of the quadrat they cover.
- Repeat - Place the same quadrat at ten or more random coordinates, counting each time.
- Find the mean - Work out the mean number per quadrat.
Safety
- Working outdoors - Watch out for uneven ground, and wear suitable footwear and sun protection.
- Soil and plants - Cover any cuts before you start, and wash your hands after touching soil or plants and before you eat.
Worked example - Estimating daisies in a field
A student counted the daisies in ten randomly placed 0.25 m2 quadrats in a field with an area of 100 m2. The counts were 4, 6, 3, 7, 5, 4, 6, 5, 5, and 5.
Estimate the total number of daisies in the whole field.
Step 1 - Find the mean number of daisies per quadrat
Add the counts and divide by the number of quadrats.
Step 2 - Work out how many quadrats would fit in the field
The field is 100 m2 and each quadrat is 0.25 m2.
100 ÷ 0.25 = 400 quadrat-sized areas
Step 3 - Scale up to estimate the total
Multiply the mean per quadrat by the number of quadrat-sized areas.
Total = 5.0 × 400 = 2,000 daisies
Common exam questions
Question 1
Why are the quadrats placed at random positions?
So the sample isn't biased and fairly represents the whole habitat.
Question 2
A student's ten quadrat counts include one of 40 when the rest are between 2 and 6. What should they do with it?
Treat it as an anomaly and leave it out before calculating the mean.
Question 3
Give one way to make a population estimate more reliable.
Take more quadrats, so the mean is less affected by chance. "Be more careful" wouldn't be accepted.