5.3 - Mendelian Genetics
The basics of inheritance and Mendel's laws
Genetics is the study of how traits are passed from parents to offspring through genes, segments of DNA that code for specific characteristics. Gregor Mendel, a 19th-century scientist, laid the foundation for modern genetics through his experiments with pea plants. His discoveries led to two fundamental principles, known as Mendel's laws, which explain how traits are inherited.
Mendel's law of segregation
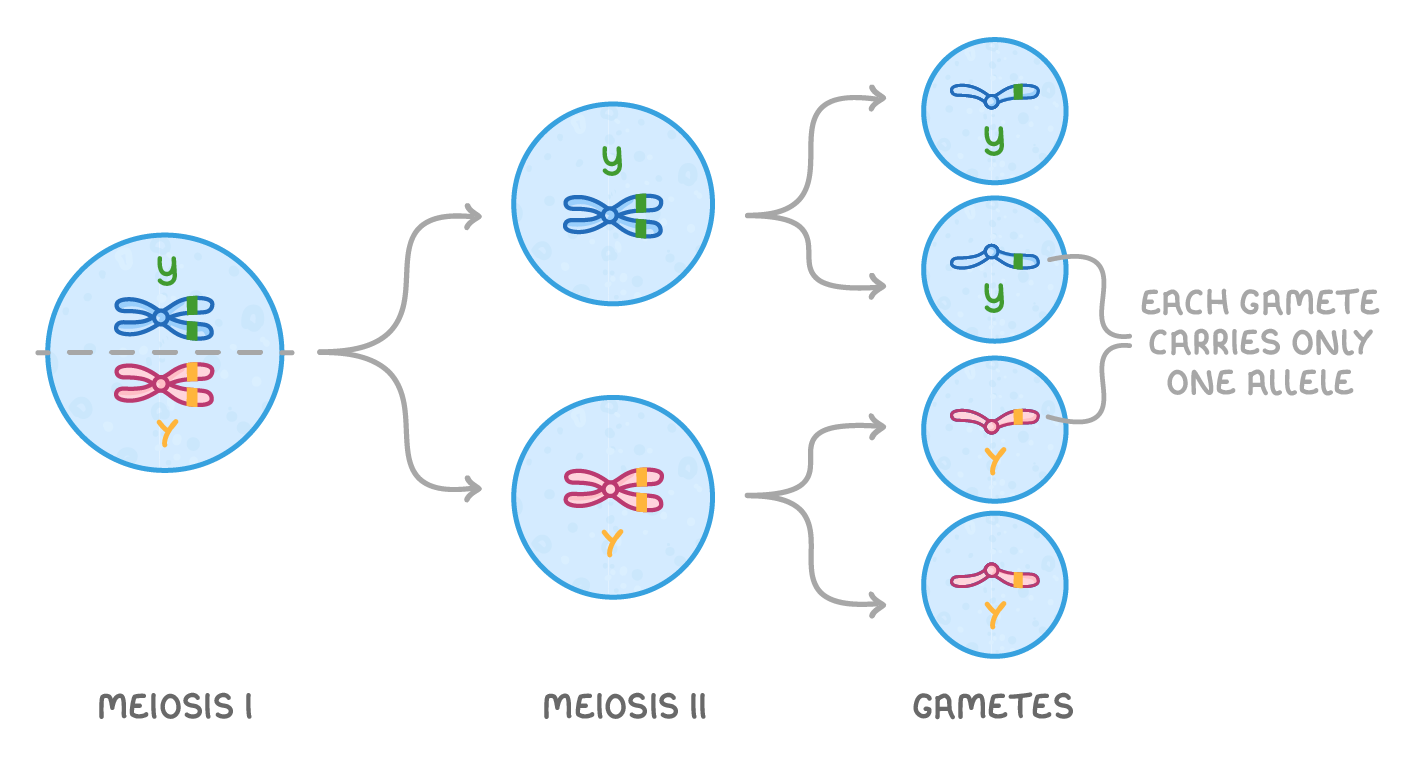
This law states that during the formation of gametes (sex cells like sperm and egg), the two alleles for a gene separate, so each gamete carries only one allele for each gene.
Key aspects of segregation:
- Mechanism - When a diploid organism (with two sets of chromosomes) produces gametes, the alleles segregate during meiosis, a type of cell division that halves the chromosome number.
- Result - Each offspring inherits one allele from each parent, restoring the diploid number upon fertilization.
- Example - If a plant has two alleles for seed color (yellow, represented as 'Y' and green, represented as 'y'), half of its gametes will carry the yellow allele, and half will carry the green allele.
Mendel's law of independent assortment
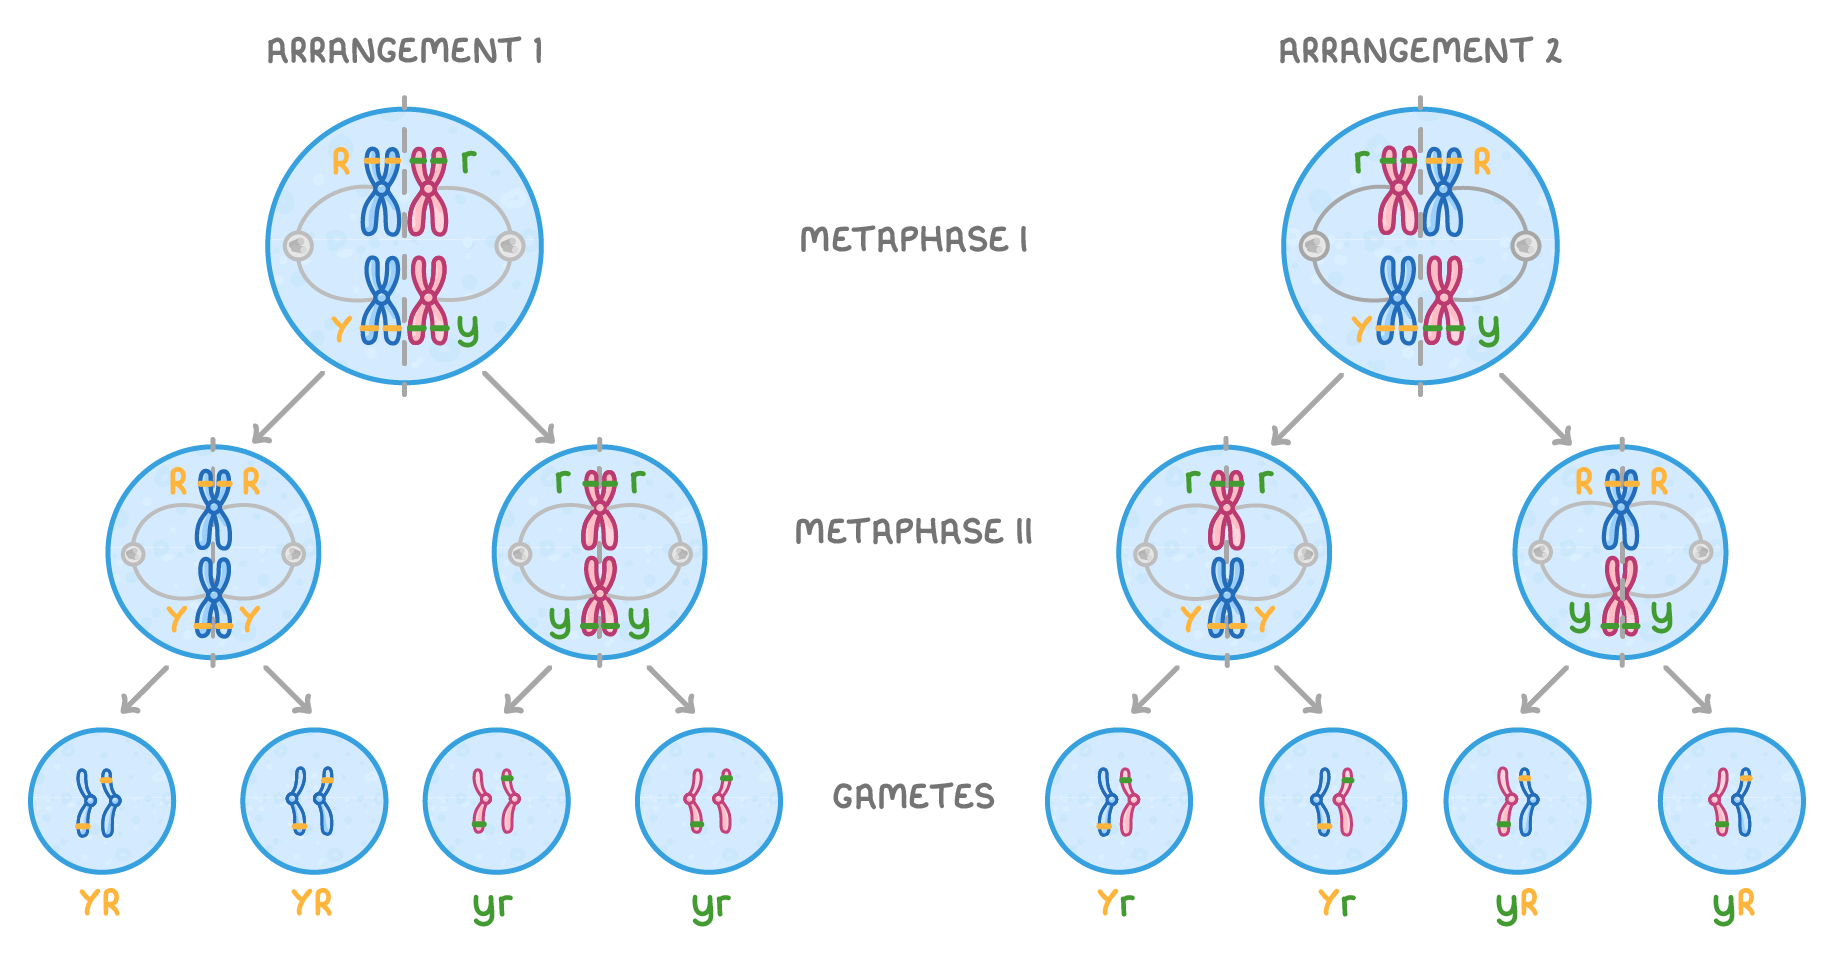
This law states that alleles for different genes are inherited independently of one another when they are located on different chromosomes.
Key aspects of independent assortment:
- Mechanism - During meiosis, chromosomes line up randomly, so the distribution of alleles for one gene does not influence the distribution of alleles for another gene on a different chromosome.
- Result - This creates a variety of possible allele combinations in gametes, increasing genetic diversity in offspring.
- Limitation - This law applies only to genes on different chromosomes; genes on the same chromosome may be linked and inherited together.
These laws form the basis for predicting how traits are passed down through generations, providing a framework for understanding inheritance patterns.
Key genetic terminology and concepts
Before diving into inheritance patterns, it's essential to understand the core terms that describe genetic makeup and expression. These concepts are critical for analyzing how traits manifest in organisms.
Essential genetic terms
- Gene - A segment of DNA that codes for a specific trait or function, such as eye color or enzyme production.
- Allele - Different versions of a gene; for example, a gene for seed color might have a yellow allele and a green allele.
- Genotype - The specific combination of alleles an organism carries for a gene or set of genes (e.g., YY for two yellow alleles).
- Phenotype - The observable expression of a genotype, such as yellow seeds or blue eyes, influenced by the alleles and sometimes the environment.
- Homozygous - Having two identical alleles for a gene (e.g., YY or yy).
- Heterozygous - Having two different alleles for a gene (e.g., Yy).
- Dominant allele - An allele that is expressed in the phenotype even if only one copy is present (often denoted with a capital letter, like Y for yellow seeds).
- Recessive allele - An allele that is only expressed in the phenotype if two copies are present (often denoted with a lowercase letter, like y for green seeds).
These terms help describe the genetic composition of organisms and predict how traits will appear in offspring based on inherited alleles.
The role of fertilization in genetic variation
Fertilization, the fusion of male and female gametes, is a key process in sexual reproduction that not only produces a new organism but also drives genetic diversity within populations. This diversity is essential for evolution and adaptation.
How fertilization increases variation
- Haploid to diploid transition - Gametes are haploid, meaning they contain one set of chromosomes. Fertilization combines two haploid gametes (one from each parent) to form a diploid zygote with two sets of chromosomes.
- Allele recombination - The zygote inherits a unique mix of alleles from each parent, creating new genetic combinations not present in either parent.
- Impact on populations - These new combinations increase genetic variation, providing a pool of traits that can be selected for or against by environmental pressures, driving evolution.
This shuffling of genetic material ensures that each offspring is genetically unique (except in identical twins), contributing to the diversity of life.
Using probability to predict inheritance patterns
Since inheritance involves the random assortment of alleles during gamete formation and fertilization, probability rules can be used to predict the likelihood of offspring inheriting specific traits. These statistical tools are fundamental in genetics.
Laws of probability in genetics
Probability calculates the chance of certain genetic outcomes based on the alleles parents carry. Two key rules apply.
Formula for mutually exclusive events:
Where P(A or B) is the probability of either event A or event B occurring, P(A) is the probability of event A, and P(B) is the probability of event B. This rule is used when two outcomes cannot happen simultaneously, such as an offspring inheriting one specific genotype over another.
Formula for independent events:
Where P(A and B) is the probability of both event A and event B occurring, P(A) is the probability of event A, and P(B) is the probability of event B. This rule applies when the occurrence of one event does not affect the other, such as inheriting alleles for two different genes on separate chromosomes.
These probability rules allow geneticists to predict the chances of specific genotypes and phenotypes in offspring, forming the basis for tools like Punnett squares.
Types of genetic crosses and their purposes
Genetic crosses are controlled breeding experiments used to study inheritance patterns and determine whether alleles are dominant or recessive. Different types of crosses provide insights into specific genetic relationships.
Monohybrid cross
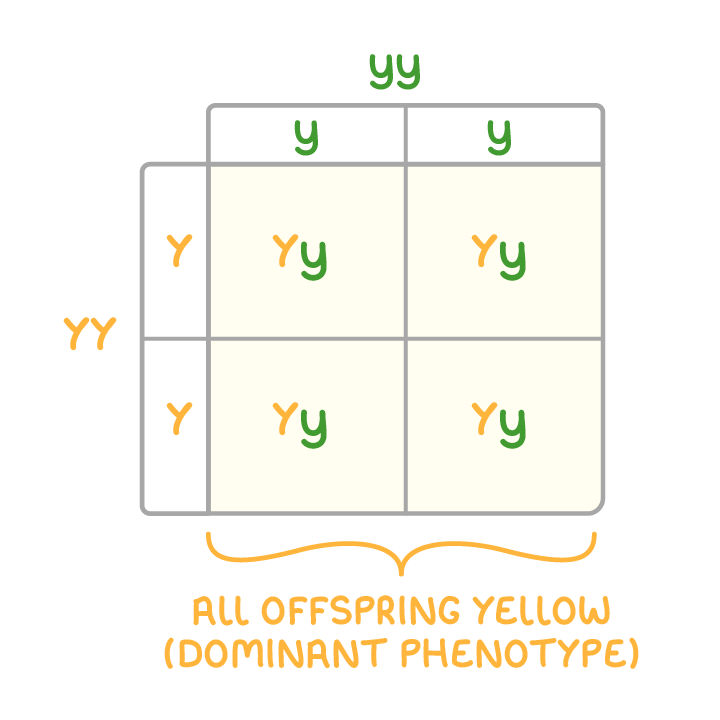
A cross between two organisms that focuses on the inheritance of a single gene with two alleles. The purpose is to determine if an allele is dominant or recessive by observing the phenotypic ratio in offspring. For example, crossing a homozygous yellow-seeded plant (YY) with a homozygous green-seeded plant (yy) to see if yellow or green is dominant.
Dihybrid cross
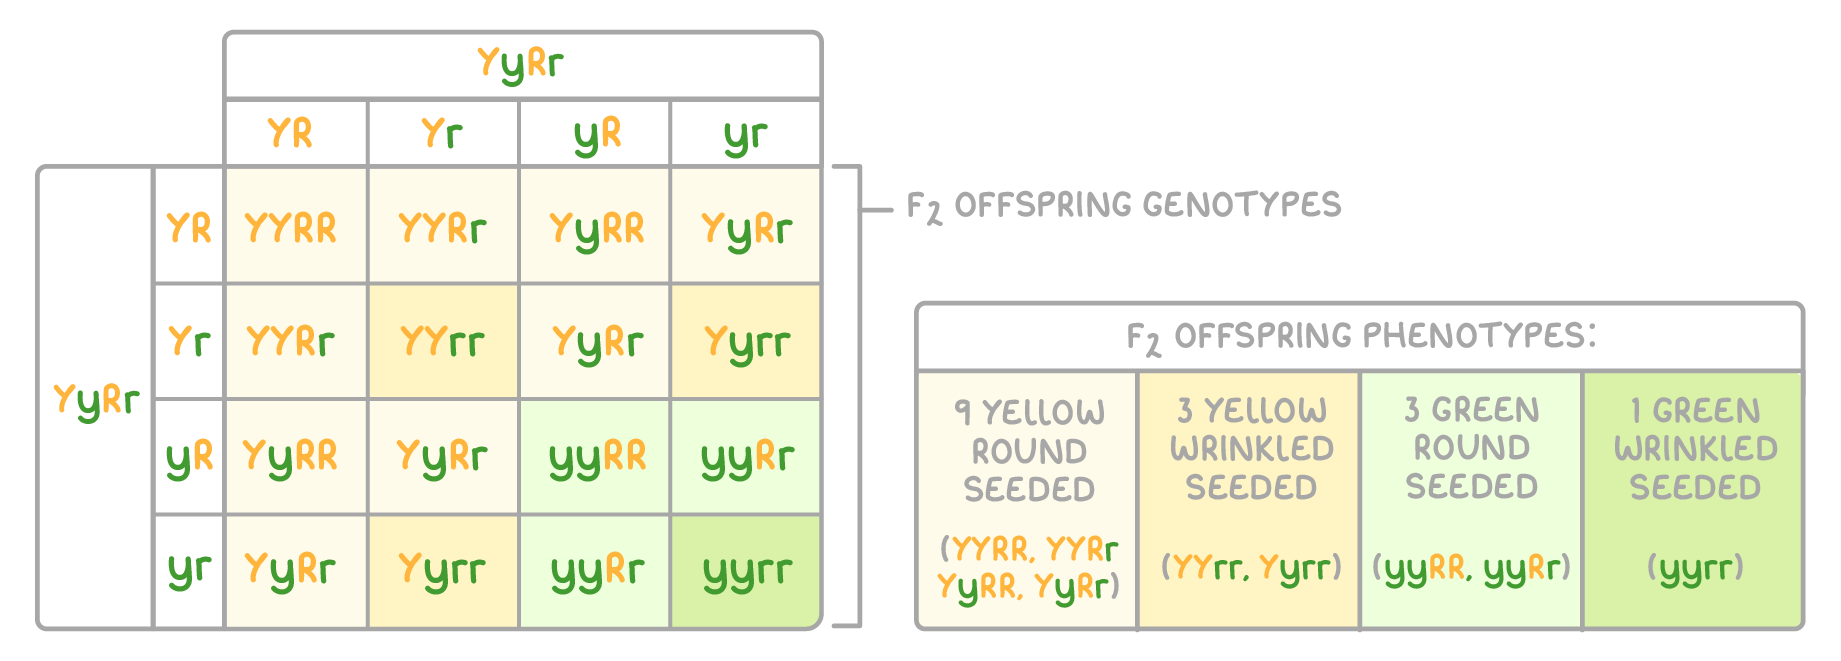
A cross between two organisms that examines the inheritance of two different genes, each with two alleles, often on different chromosomes. The purpose is to test Mendel's law of independent assortment by checking if traits are inherited independently, typically resulting in a 9:3:3:1 phenotypic ratio in the second generation (F2). For example, crossing plants for seed color (yellow or green) and seed shape (round or wrinkled) to observe combined inheritance patterns.
Test cross
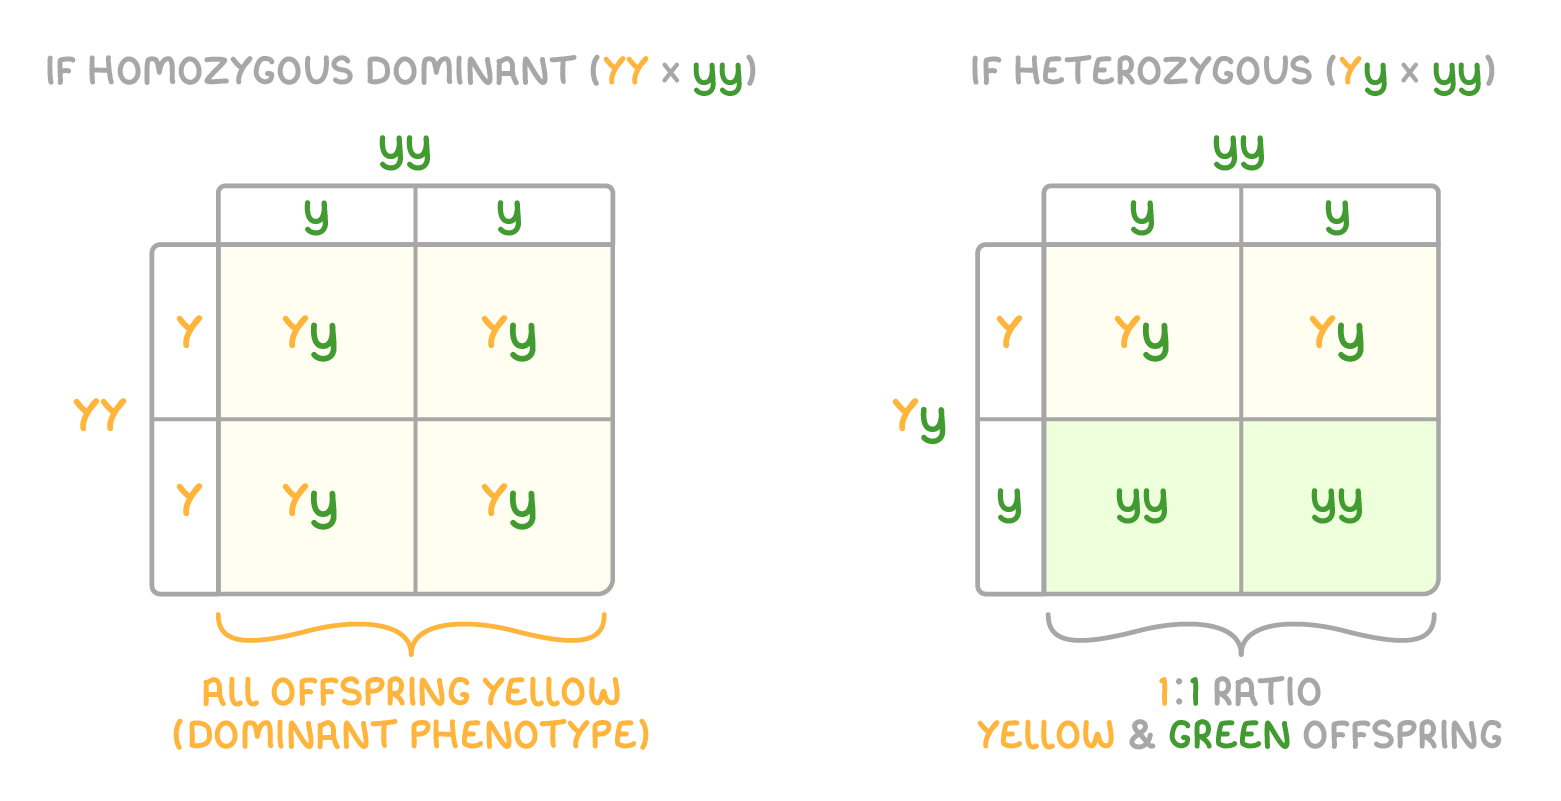
A cross between an organism with an unknown genotype for a dominant trait and a homozygous recessive organism for that trait. The purpose is to determine if the unknown genotype is homozygous dominant or heterozygous based on the offspring's phenotypes. For example, crossing a yellow-seeded plant of unknown genotype (Y_ ) with a green-seeded plant (yy); if any green offspring appear, the unknown plant is heterozygous (Yy).
These crosses are practical tools for understanding genetic inheritance and predicting offspring traits in both lab settings and natural populations.
Predicting inheritance using Punnett squares and pedigrees
Tools like Punnett squares and pedigrees help visualize and predict inheritance patterns, making it easier to determine the likelihood of specific genotypes and phenotypes in offspring or across generations.
Using Punnett squares
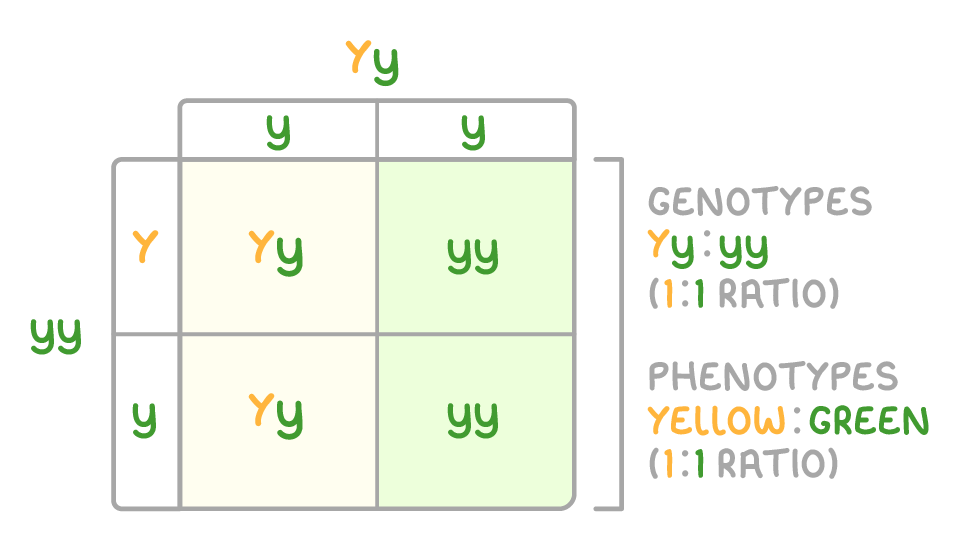
Punnett squares are diagrams that predict the possible genotypes and phenotypes of offspring from a genetic cross by mapping out all possible allele combinations from the parents' gametes.
Steps to create a Punnett square:
- Determine the genotypes of both parents for the gene(s) in question.
- List the possible alleles each parent can contribute through their gametes.
- Draw a grid with the gametes of one parent across the top and the other down the side.
- Fill in the grid by combining the alleles from each parent to show all possible offspring genotypes.
- Analyze the grid to determine the genotypic and phenotypic ratios of the offspring.
For a monohybrid cross between a heterozygous yellow-seeded plant (Yy) and a homozygous recessive green-seeded plant (yy), the parent 1 gametes are Y and y, parent 2 gametes are y and y, possible offspring genotypes are Yy and yy (1:1 ratio), and phenotypes are yellow and green seeds (1:1 ratio). This tool simplifies the application of probability to predict inheritance outcomes.
Using pedigrees for inheritance patterns
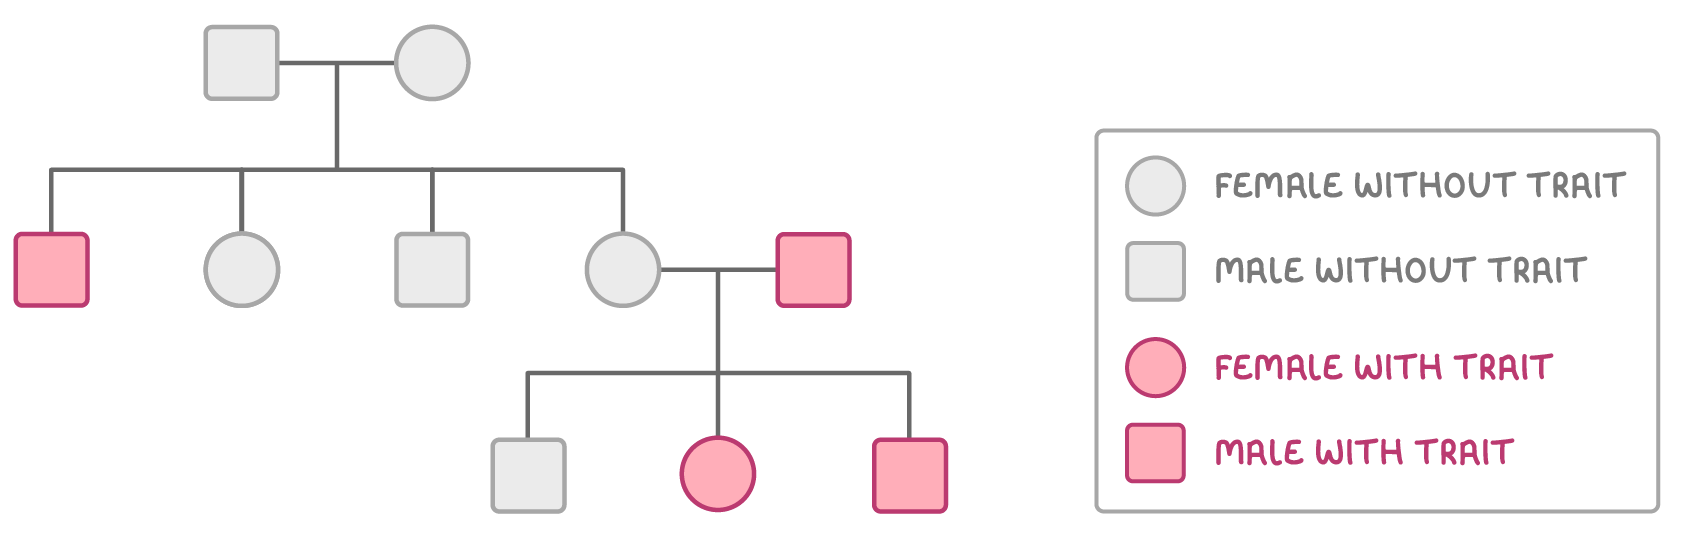
A pedigree is a family tree diagram that shows the occurrence of traits across generations, often used to identify patterns of inheritance. The purpose is to predict whether a trait is autosomal (on non-sex chromosomes), sex-linked (on sex chromosomes), dominant, or recessive based on how it appears in the family.
Key features of pedigrees:
- Males are represented by squares, females by circles.
- Shaded shapes indicate individuals with the trait.
- Lines connect family relationships.
- Patterns such as skipping generations suggest recessive traits, while traits appearing in every generation often indicate dominance.
- Sex-linked traits often show gender-specific patterns (e.g., more males affected for X-linked recessive traits).
These tools together provide a comprehensive way to analyze and predict genetic inheritance, from simple single-gene traits to complex family histories.
Worked example - Calculating probability in a monohybrid cross
In a cross between two heterozygous plants for seed color (Yy x Yy), where Y (yellow) is dominant over y (green), calculate the probability of an offspring having green seeds.
Step 1: Determine possible genotypes
Using a Punnett square:
- Parent 1 gametes: Y and y
- Parent 2 gametes: Y and y
- Possible offspring genotypes: YY, Yy, Yy, yy
Step 2: Identify phenotype ratios
- Genotypes: YY (1), Yy (2), yy (1)
- Phenotypes: Yellow (YY and Yy, total 3) and green (yy, total 1)
- Ratio: 3 yellow : 1 green
Step 3: Calculate probability
- Probability of green seeds (yy genotype) = 1 out of 4 possible outcomes
- Probability = 1/4 = 0.25 or 25%
The probability of an offspring having green seeds is 25%.
Applying statistical analysis with chi-square testing
In genetics, observed results from crosses don't always perfectly match predicted ratios due to random chance. The chi-square test is a statistical method used to determine if the differences between observed and expected outcomes are due to chance or indicate other factors at play, such as genetic linkage.
Purpose of chi-square testing
- Hypothesis testing - To evaluate if observed phenotypic ratios in offspring match the expected ratios predicted by Mendel's laws.
- Significance assessment - To determine if deviations from expected results are statistically significant, suggesting possible errors, environmental influences, or non-Mendelian inheritance.
Steps for chi-square testing
- State the null hypothesis, typically that there is no significant difference between observed and expected results (e.g., offspring fit a 3:1 ratio for a monohybrid cross between two heterozygous genotypes for a trait).
- Calculate expected frequencies based on the predicted ratio and total number of offspring.
- Use the chi-square formula to compute the test statistic:
- Compare the calculated chi-square value to a critical value from a chi-square distribution table, based on degrees of freedom (number of categories minus one) and a significance level (often 0.05).
- Interpret the result: If the calculated value is less than the critical value, accept the null hypothesis (differences are due to chance); if greater, reject it (differences are significant).
This test is a powerful tool for geneticists to validate experimental data and refine understanding of inheritance mechanisms.
Worked example - Chi-square test for a monohybrid cross
In a monohybrid cross (Yy x Yy), the expected phenotypic ratio is 3 yellow : 1 green. A researcher observes 74 yellow-seeded and 26 green-seeded offspring (total 100). Perform a chi-square test to determine if the observed results fit the expected ratio.
Step 1: State the null hypothesis
The observed results do not differ significantly from the expected 3:1 ratio.
Step 2: Calculate expected frequencies
- Total offspring = 100
- Expected yellow = 3/4 x 100 = 75
- Expected green = 1/4 x 100 = 25
Step 3: Apply chi-square formula
- For yellow: (74 - 75)2 / 75 = (-1)2 / 75 = 1 / 75 = 0.0133
- For green: (26 - 25)2 / 25 = (1)2 / 25 = 1 / 25 = 0.04
- Total chi-square = 0.0133 + 0.04 = 0.0533
Step 4: Compare to critical value
- Degrees of freedom = 2 categories - 1 = 1
- Critical value at 0.05 significance level for 1 degree of freedom = 3.84
- Calculated chi-square (0.0533) < critical value (3.84)
Step 5: Interpret the result
Since the calculated chi-square value is less than the critical value, we accept the null hypothesis. The observed results fit the expected 3:1 ratio, and any deviation is likely due to random chance.