2.3 - Mass Spectrometry
- 1
How a mass spectrometer works
- 2
Interpreting mass spectra
- 3
Calculating relative atomic mass and isotopic mass from mass spectra
- 4
Predicting mass spectra of diatomic molecules
How a mass spectrometer works
A mass spectrometer is an analytical tool used to measure the mass-to-charge ratio (m/z) of ions. It determines the m/z of ions based on their degree of deflection in a magnetic field.
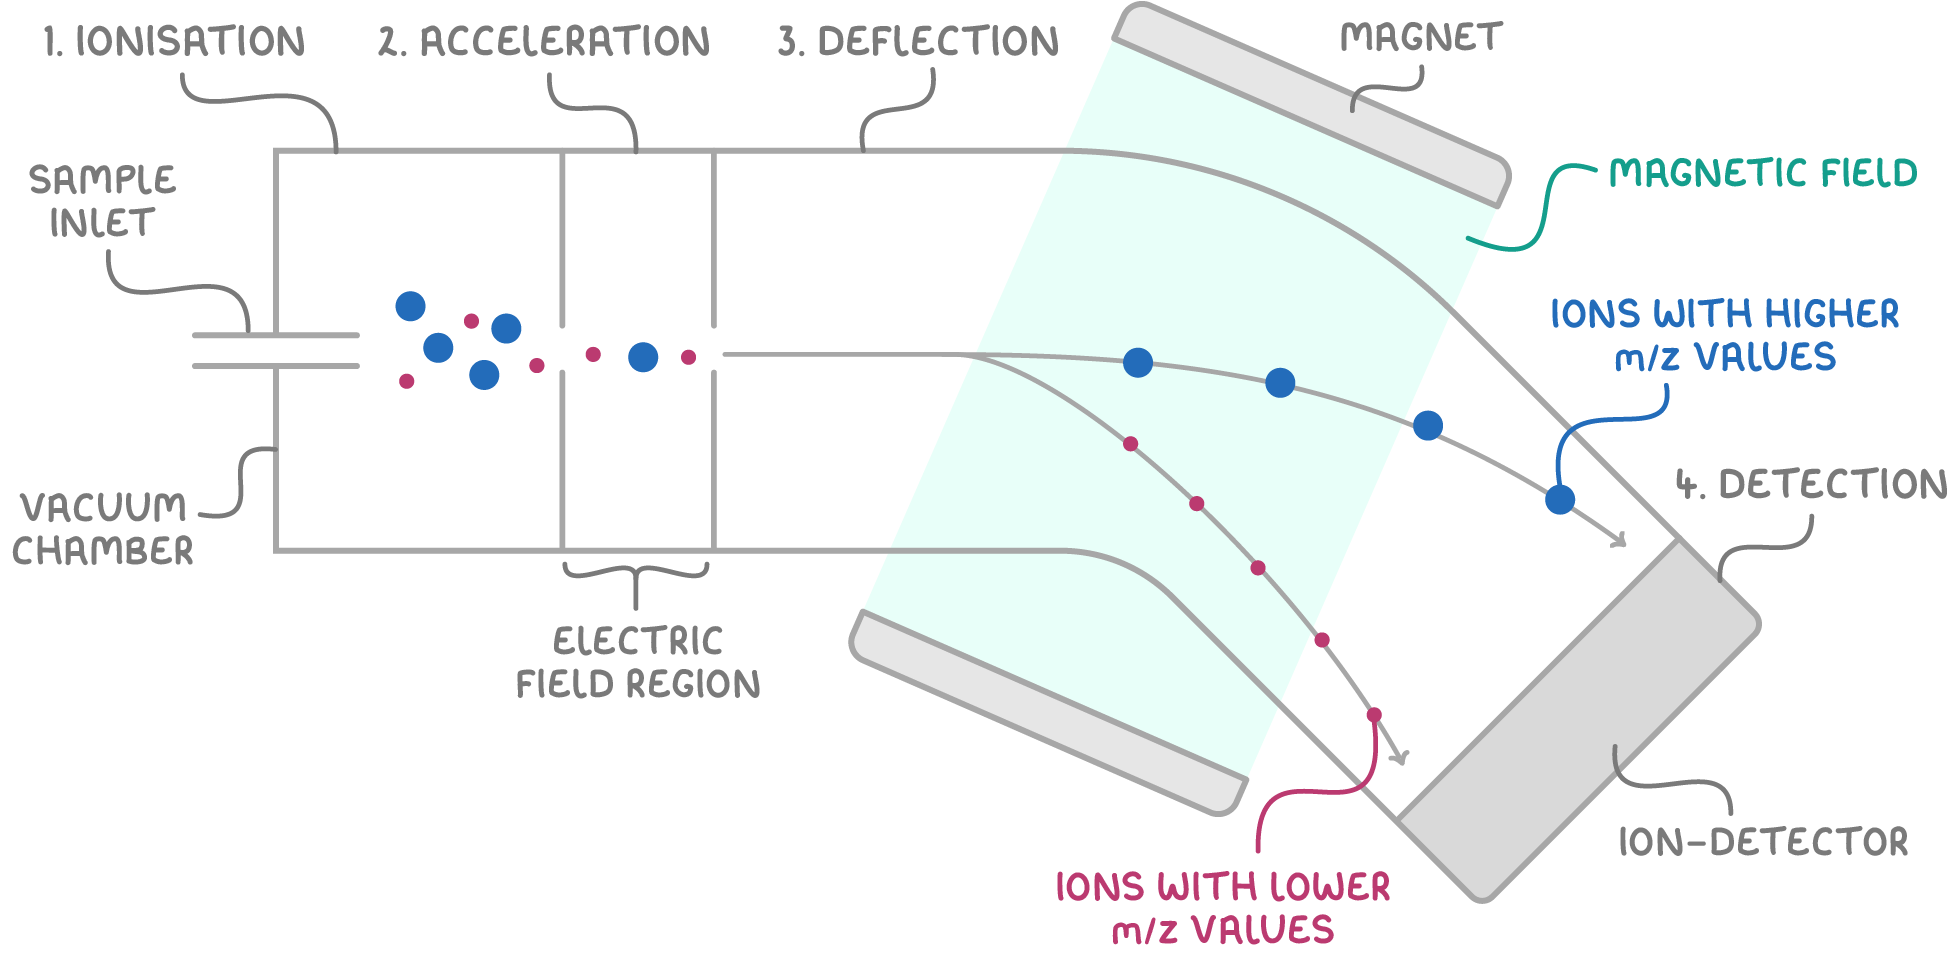
A mass spectrometer includes four main parts:
-
Ionisation - The vaporised sample is bombarded with high-energy electrons to remove one or more electrons from each atom or molecule, resulting in positively charged ions.
-
Acceleration - The positive ions are accelerated towards a negatively charged plate by an electric field.
-
Deflection - The ions enter a magnetic field perpendicular to the ion path, causing ions to travel in a circular trajectory. The radius of this path depends on the m/z ratio of each ion. Heavier ions or those with lower charges will be deflected less than lighter ions or those with higher charges.
-
Detection - As ions reach the detector, they gain electrons which generates an electric current. The size of this current is proportional to the abundance of each ion species. The detector only receives ions with a specific m/z ratio for a given magnetic field strength. For example, ions with a mass of 16 and a charge of 1+ will be detected at the same time as ions with a mass of 32 and a charge of 2+, as both have a m/z ratio of 16.
By varying the magnetic field strength, ions with different m/z ratios can be sequentially detected.
Interpreting mass spectra
A mass spectrum plots the relative abundance of ions against their mass-to-charge ratio (m/z).
-
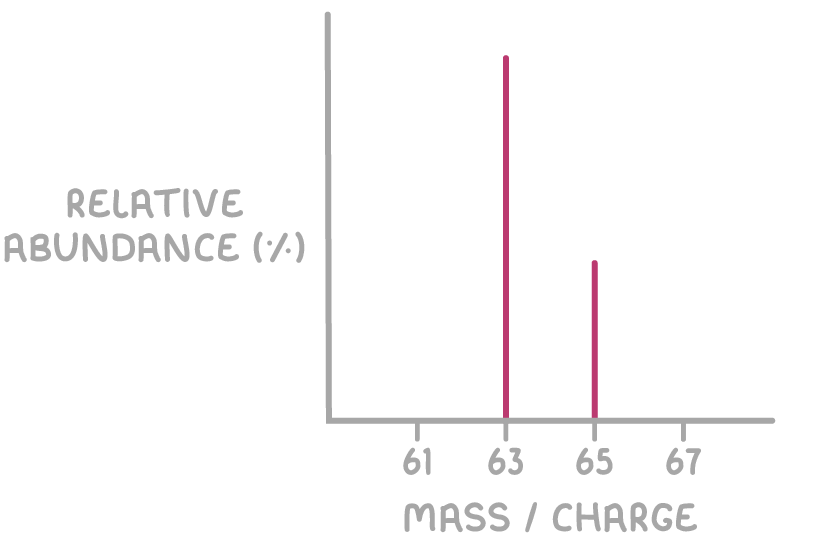
The x-axis displays the m/z values. The m/z of each peak equals the relative mass of the ion.
-
The y-axis indicates the relative abundance of each ion, either in arbitrary units or as a percentage. For elemental samples, each peak represents a different isotope.
-
The relative height of each peak shows how abundant the isotope is.
-
Elements with only one stable isotope will show a single peak.
Below is the mass spectrum of an element with two stable isotopes.
For molecular samples, the peak at the highest m/z value is the molecular ion (M+), assuming a value of z = 1.
- The m/z of the molecular ion peak matches the molecule's relative molecular mass (Mr).
- Peaks at lower m/z values come from fragments of the molecular ion. Below is the mass spectrum for a compound with a molecular mass of 72.
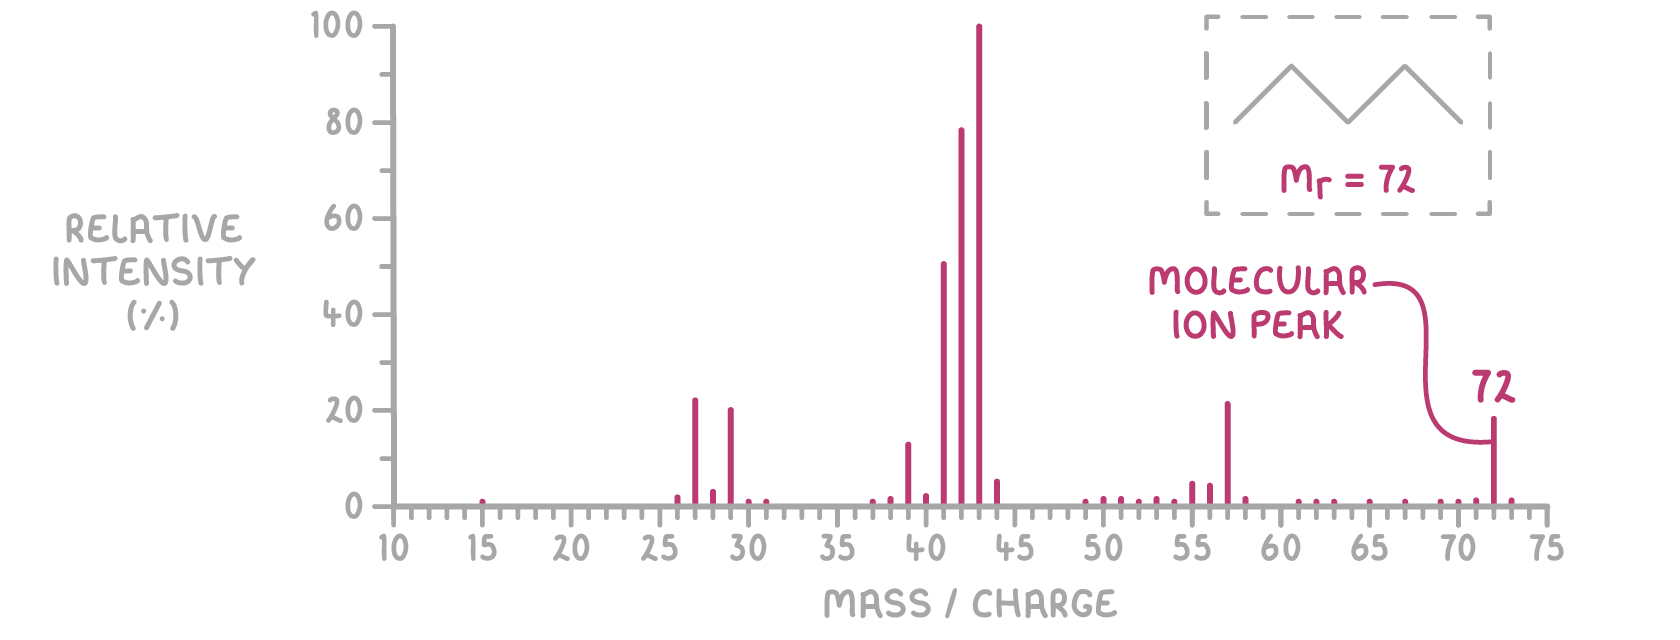
A smaller M+1 peak occurs at m/z = 73, representing molecular ions that contain the carbon-13 isotope.
Calculating relative atomic mass from mass spectra
To find an element's relative atomic mass (Ar) from its mass spectrum, follow these steps:
- Multiply the relative isotopic mass by its relative abundance for each isotope.
- Add these products together.
- Divide the total by the sum of the relative abundances (100 if using percentages).
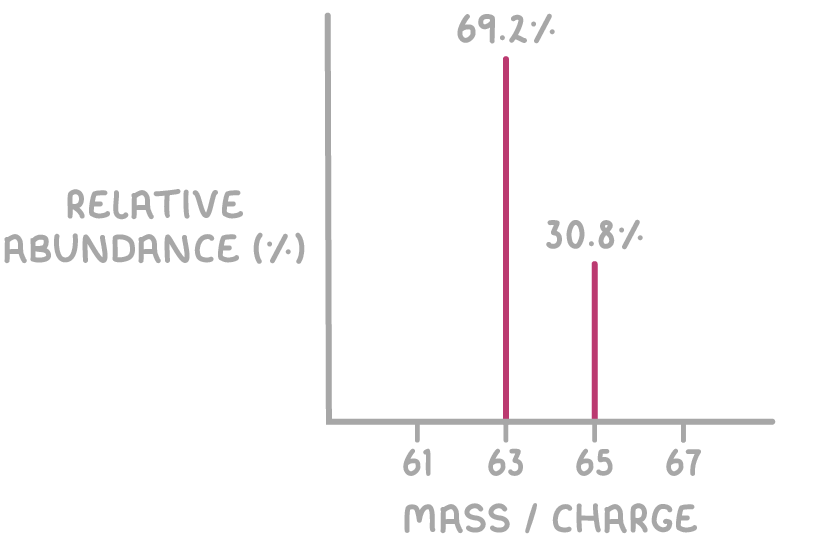
Worked example 1 - Calculating the relative atomic mass of copper from its mass spectrum
Calculate the relative atomic mass (Ar) of copper using the mass spectrum shown below:
Step 1: Multiply the relative isotopic mass by its relative abundance for each isotope
For 63Cu: 63 x 69.2 = 4,359.6
For 65Cu: 65 x 30.8 = 2,002.0
Step 2: Sum these values
Sum = 4,359.6 + 2,002.0 = 6,361.6
Step 3: Divide by the total relative abundance
Total relative abundance = 69.2 + 30.8 = 100.0
16
Therefore, the calculated relative atomic mass (Ar) of copper from its mass spectrum is 63.6.
Worked example 2 - Calculating isotopic mass from relative atomic mass
Magnesium can exist in three isotopes. 78.99% of magnesium is 24Mg and 10.00% of magnesium is 25Mg. Given that the Ar of magnesium is 24.31, calculate the abundance and isotopic mass of the third isotope.
Step 1: Calculate the abundance of the third isotope
Abundance of the third isotope =
Step 2: Use the relative atomic mass formula to find the isotopic mass
Relative atomic mass formula =
Step 3: Rearrange to solve for X:
1,895.76 + 250 + 11.01x = 2,431
So, the isotopic mass of the third isotope is approximately 26 (rounded to the nearest whole number).
Worked example 3 - Predicting the mass spectra for diatomic molecules
Chlorine has two isotopes. 35Cl has an abundance of 75% and 37Cl has an abundance of 25%. Predict the mass spectrum of Cl2.
Step 1: Express each percentage as a decimal
75% = 0.75 and 25% = 0.25
Step 2: Create a table showing all different Cl2 molecules
| Isotope | Calculation |
|---|---|
| ^35^Cl-^35^Cl | 0.75 × 0.75 = 0.5625 |
| ^35^Cl-^37^Cl | 0.75 × 0.25 = 0.1875 |
| ^37^Cl-^35^Cl | 0.25 × 0.75 = 0.1875 |
| ^37^Cl-^37^Cl | 0.25 × 0.25 = 0.0625 |
Step 3: Combine abundances for identical molecules
For 35Cl37Cl and 37Cl35Cl: 0.1875 + 0.1875 = 0.375
Step 4: Calculate relative abundances and molecular masses
| Molecule | Relative abundance | Molecular mass |
|---|---|---|
| ^35^Cl-^35^Cl | 35 + 35 = 70 | |
| ^35^Cl-^37^Cl | 35 + 37 = 72 | |
| ^37^Cl-^37^Cl | 37 + 37 = 74 |
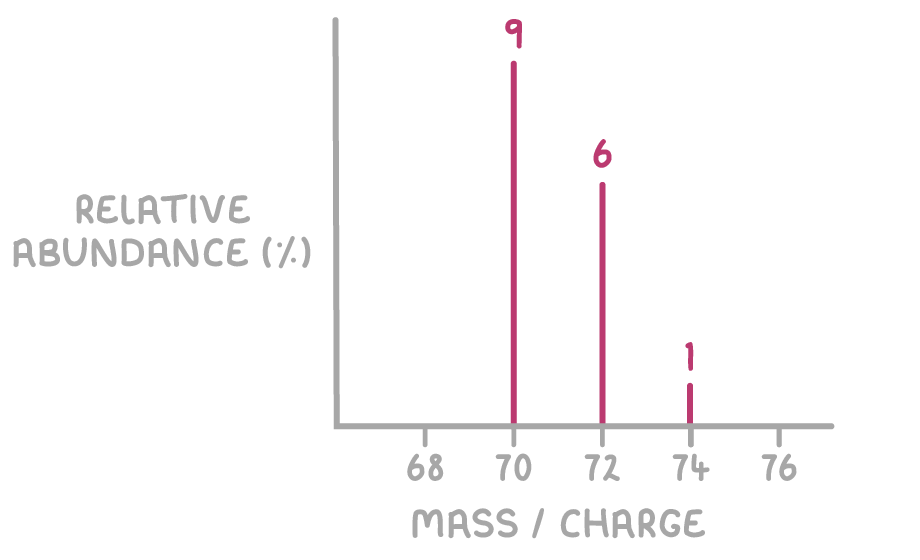
The predicted mass spectrum for Cl2 will have peaks at m/z 70, 72, and 74 with relative abundances 9, 6, and 1, respectively, as shown below.