14.5 - Acid-base Titrations, pH Curves and Indicators
- 1The shape of pH curves for different combinations of acids and bases
- 2Choosing an appropriate indicator for a titration
- 3The concept of half-equivalence in a weak acid-strong base titration
- 4The relationship between pKa and pH at the half-equivalence point
Plotting pH curves for acid-base titrations
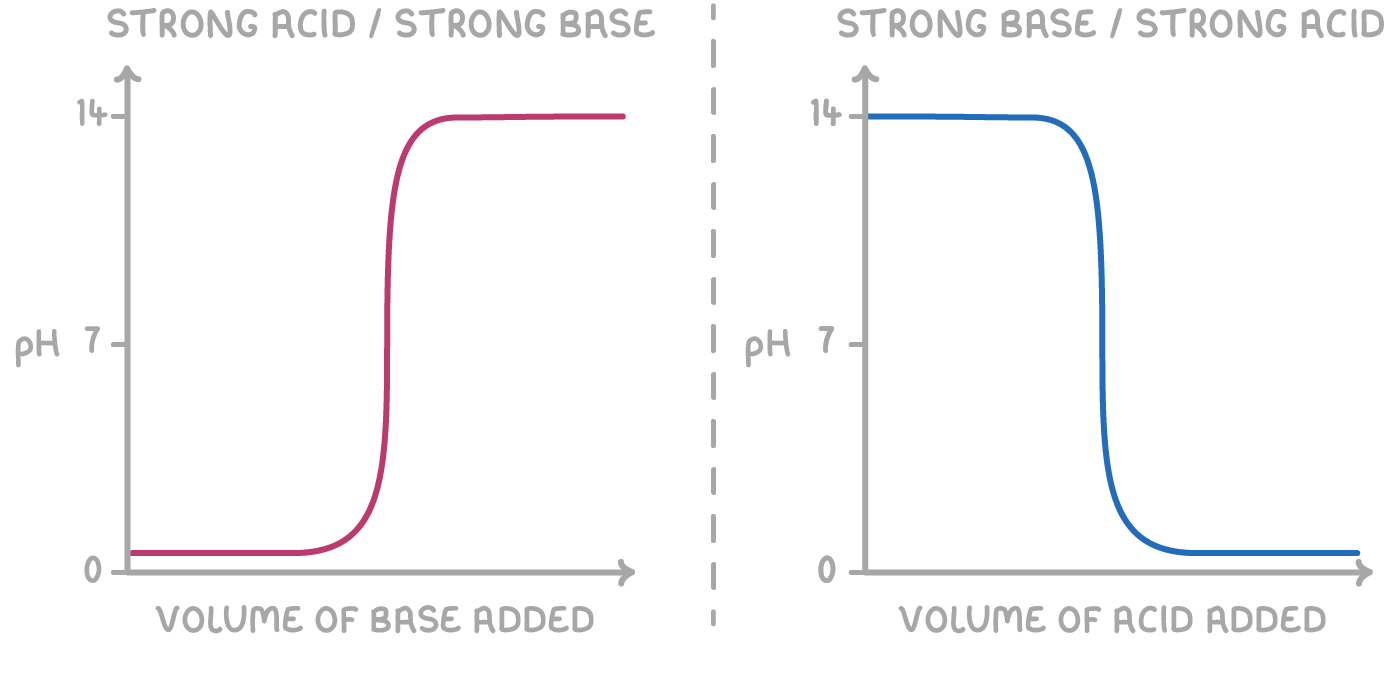
pH curves are graphs that show how the pH changes during a titration, plotting the pH of the mixture against the volume of acid or base added. The curve's shape depends on the strengths of the acid and base involved.

The shape of each graph is explained by considering:
1. Initial pH - The starting pH depends on the acid's strength. Strong acid titrations begin at a lower pH than weak acid ones.
2. Early stages - At the start, adding small amounts of base barely affects the solution's pH.
3. Equivalence point - The nearly straight part of the graph represents the equivalence point, where the moles of acid and base are stochiometrically equivalent, resulting in complete neutralisation. Here, a tiny amount of base causes a sudden, big change in pH.
- For a strong acid/strong base titration, a small amount of base leads to a rapid pH change.
- For a strong acid/weak base titration, more weak base is needed to change the pH, and the change is less noticeable.
- For a weak acid/strong base titration, less strong base is needed to cause a big pH change.
- For a weak acid/weak base titration, there's no sharp pH change at the equivalence point, making it hard to spot the exact end point using an indicator. The endpoint is the point at which the reaction between the acid and base is complete, and it coincides with the equivalence point.
4. Final pH - The pH at the titration's end depends on the base's strength. The stronger the base, the higher the final pH.
For titrations of a base with an acid, the pH curves have the same shapes but flip vertically, with pH decreasing as more acid is added.
Selecting indicators based on pH curves
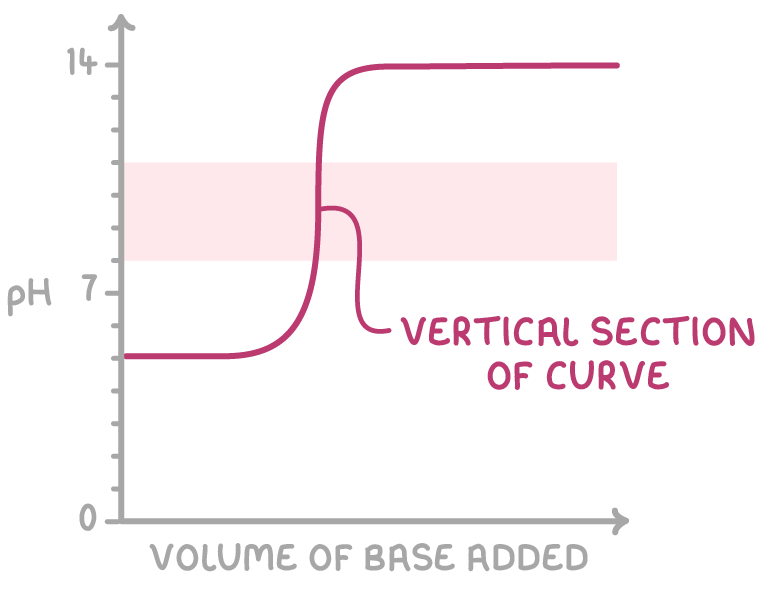
Indicators are weak acids that change colour over a specific pH range, allowing them to be used to determine the end point of a titration. The choice of indicator depends on the pH curve of the titration. For accurate results, the indicator should undergo a sharp and distinct colour change entirely within the steep vertical section of the pH curve around the equivalence point.
The following table summarises the properties and suitable titrations for two common indicators, methyl orange and phenolphthalein:
| Name of indicator | Colour at low pH | Colour at high pH | pH range | Titrations suitable for |
|---|---|---|---|---|
| Methyl orange | Red | Yellow | 3.1 – 4.4 | Strong acid/strong base / Strong acid/weak base |
| Phenolphthalein | Colourless | Pink | 8.3 – 10 | Strong acid/strong base / Weak acid/strong base |
For weak acid/weak base titrations, no suitable indicators exist because of the gradual pH change at the equivalence point. Instead, a pH meter should be used to accurately find the titration's end point.
Half-equivalence in weak acid-strong base titrations
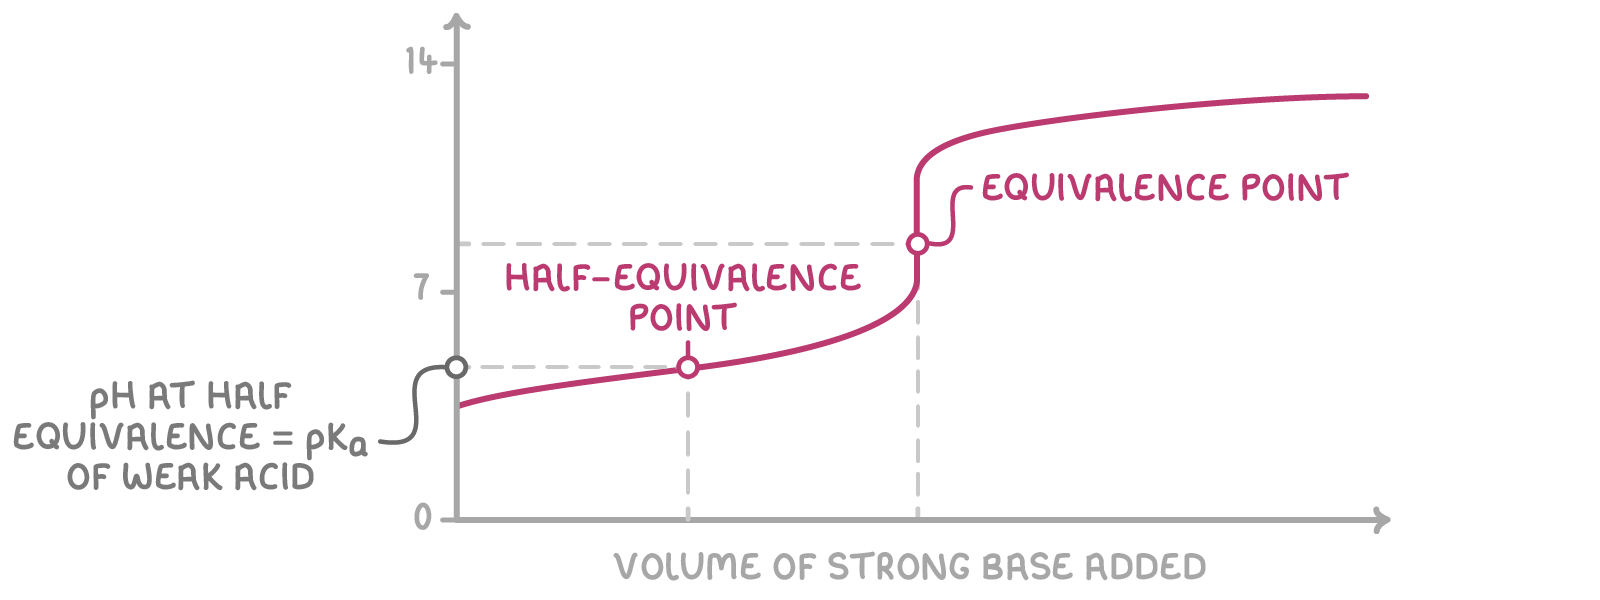
In a titration between a weak acid (HA) and a strong base, the half-equivalence point is the stage where half of the weak acid has been neutralised by the strong base. This happens when the volume of strong base added is exactly half of the volume required to reach the equivalence point.
At the half-equivalence point, the concentration of the undissociated weak acid, [HA], is equal to the concentration of its conjugate base, [A-].
Relationship between pKa and pH at half-equivalence
The dissociation of a weak acid (HA) is represented by the following equation:
HA ⇌ H+ + A-
The acid dissociation constant, Ka, is defined by:
Ka =
At the half-equivalence point, since [HA] = [A-], the equation simplifies to:
Ka = [H+]
Taking the negative logarithm of both sides gives:
pKa = log10[H+] = pH
Therefore, at the half-equivalence point, the pKa of the weak acid is equal to the pH of the solution.
The titration curve of a weak acid-strong base illustrates this relationship:
Worked example 1 - Determining pKa from a titration curve
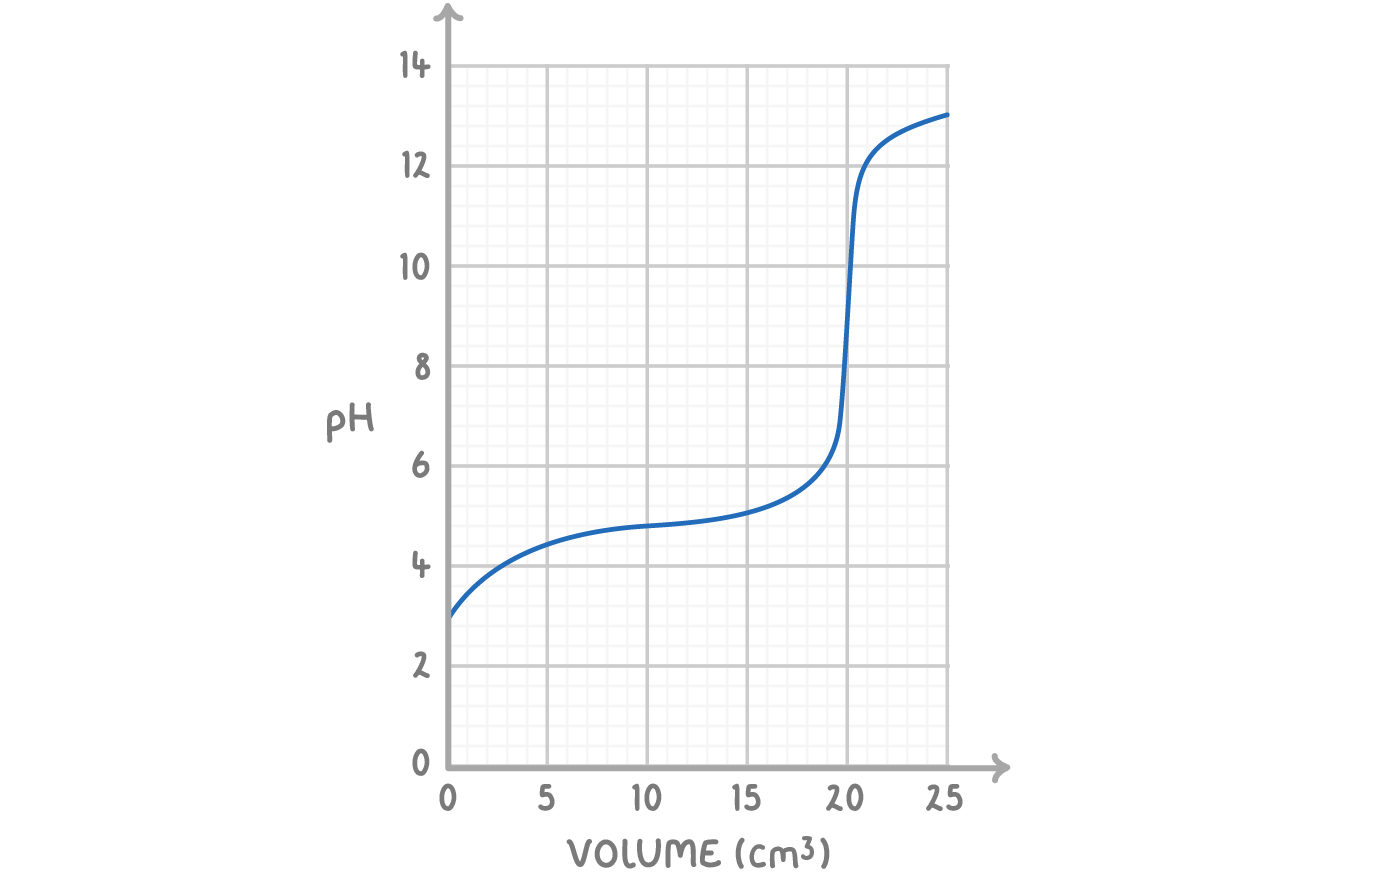
The curve above shows the pH change when 0.10 mol dm-3 solution of sodium hydroxide is added to 20 cm3 of a 0.10 mol dm-3 solution of ethanoic acid:
CH3COOH(aq) + NaOH(aq) ➔ CH3COONa(aq) + H2O(l)
Calculate the Ka of the ethanoic acid. Give your answer to 2 significant figures.
Step 1: Determine pKa of ethanoic acid
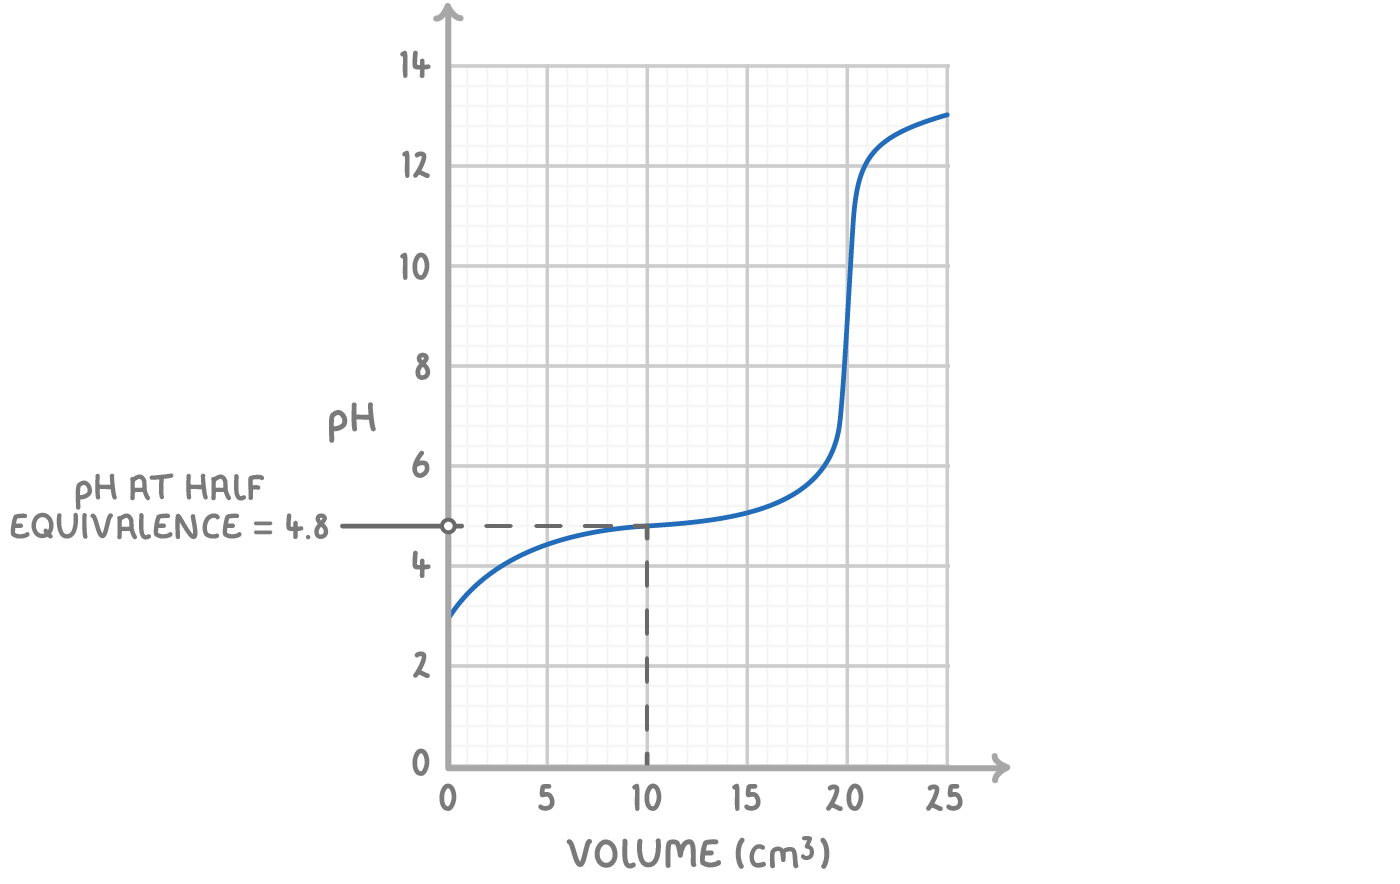
pKa = pH at half-equivalence = 4.8
Step 2: Calculate Ka of ethanoic acid
Ka = 10-pKa
Ka = 10-4.8 = 1.6 x 10⁻⁵ mol dm-3