Spectroscopy and Chromatography - exam practice
Spectroscopy and Chromatography
Question 1 of 11
The accurate relative atomic masses of four elements are shown in the table.
| Element | A_r_ |
|---|---|
| H | 1.0078 |
| C | 12.0000 |
| N | 14.0031 |
| O | 15.9949 |
The high resolution mass spectrum of a compound has a molecular ion peak with m/z = 88.0998.
Which of the following could be the molecular formula of the compound?
Explain why low resolution mass spectrometry would not allow you to distinguish between the options given in part a).
A sample of an unknown saturated hydrocarbon is injected into a high resolution mass spectrometer. It produces a molecular ion peak at m/z = 72.0936.
Draw a possible structure for and name the unknown hydrocarbon.
This question is about the use of thin-layer chromatography (TLC) to investigate 1,2-dinitrobenzene and 1,4-dinitrobenzene, the structures of which are shown in the diagram below.
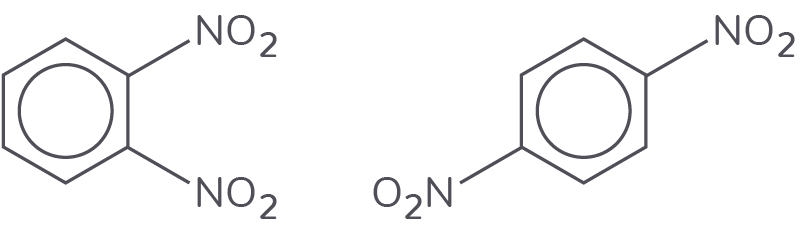
A solution of 1,4-dinitrobenzene was spotted onto a TLC plate coated with a polar solid, and the plate was run using hexane as the solvent. The diagram below shows the resulting chromatogram.
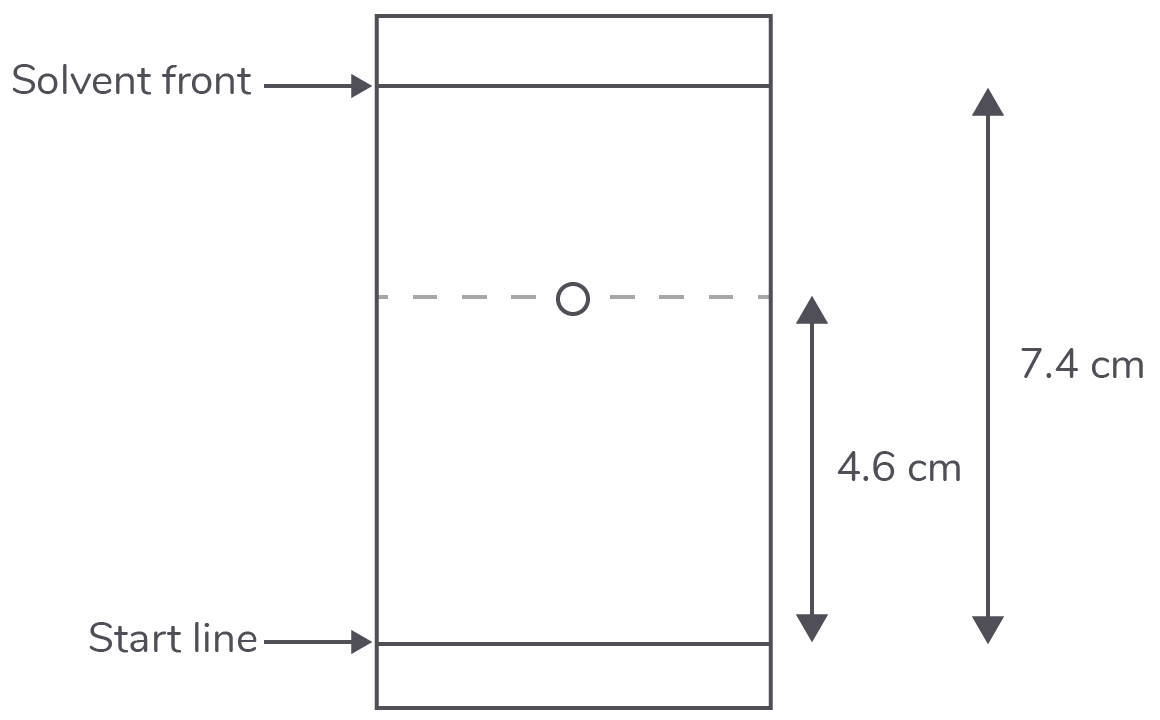
Use the chromatogram to determine the Rf value of 1,4-dinitrobenzene. Give your answer to 2 decimal places.
State what determines the distance travelled by a spot in TLC.
A second TLC experiment is carried out with 1,2-dinitrobenzene using the same conditions as before. The Rf value for 1,2-dinitrobenzene was calculated to be less than 1,4-dinitrobenzene.
State the relative polarities of 1,2-dinitrobenzene and 1,4-dinitrobenzene, and explain why 1,2-dinitrobenzene has a lower Rf.
A third TLC experiment is carried out with 1,2-dinitrobenzene using an identical TLC plate but using ethyl ethanoate as the solvent.
Explain whether the Rf value would be greater or lower than in the experiment in part c).
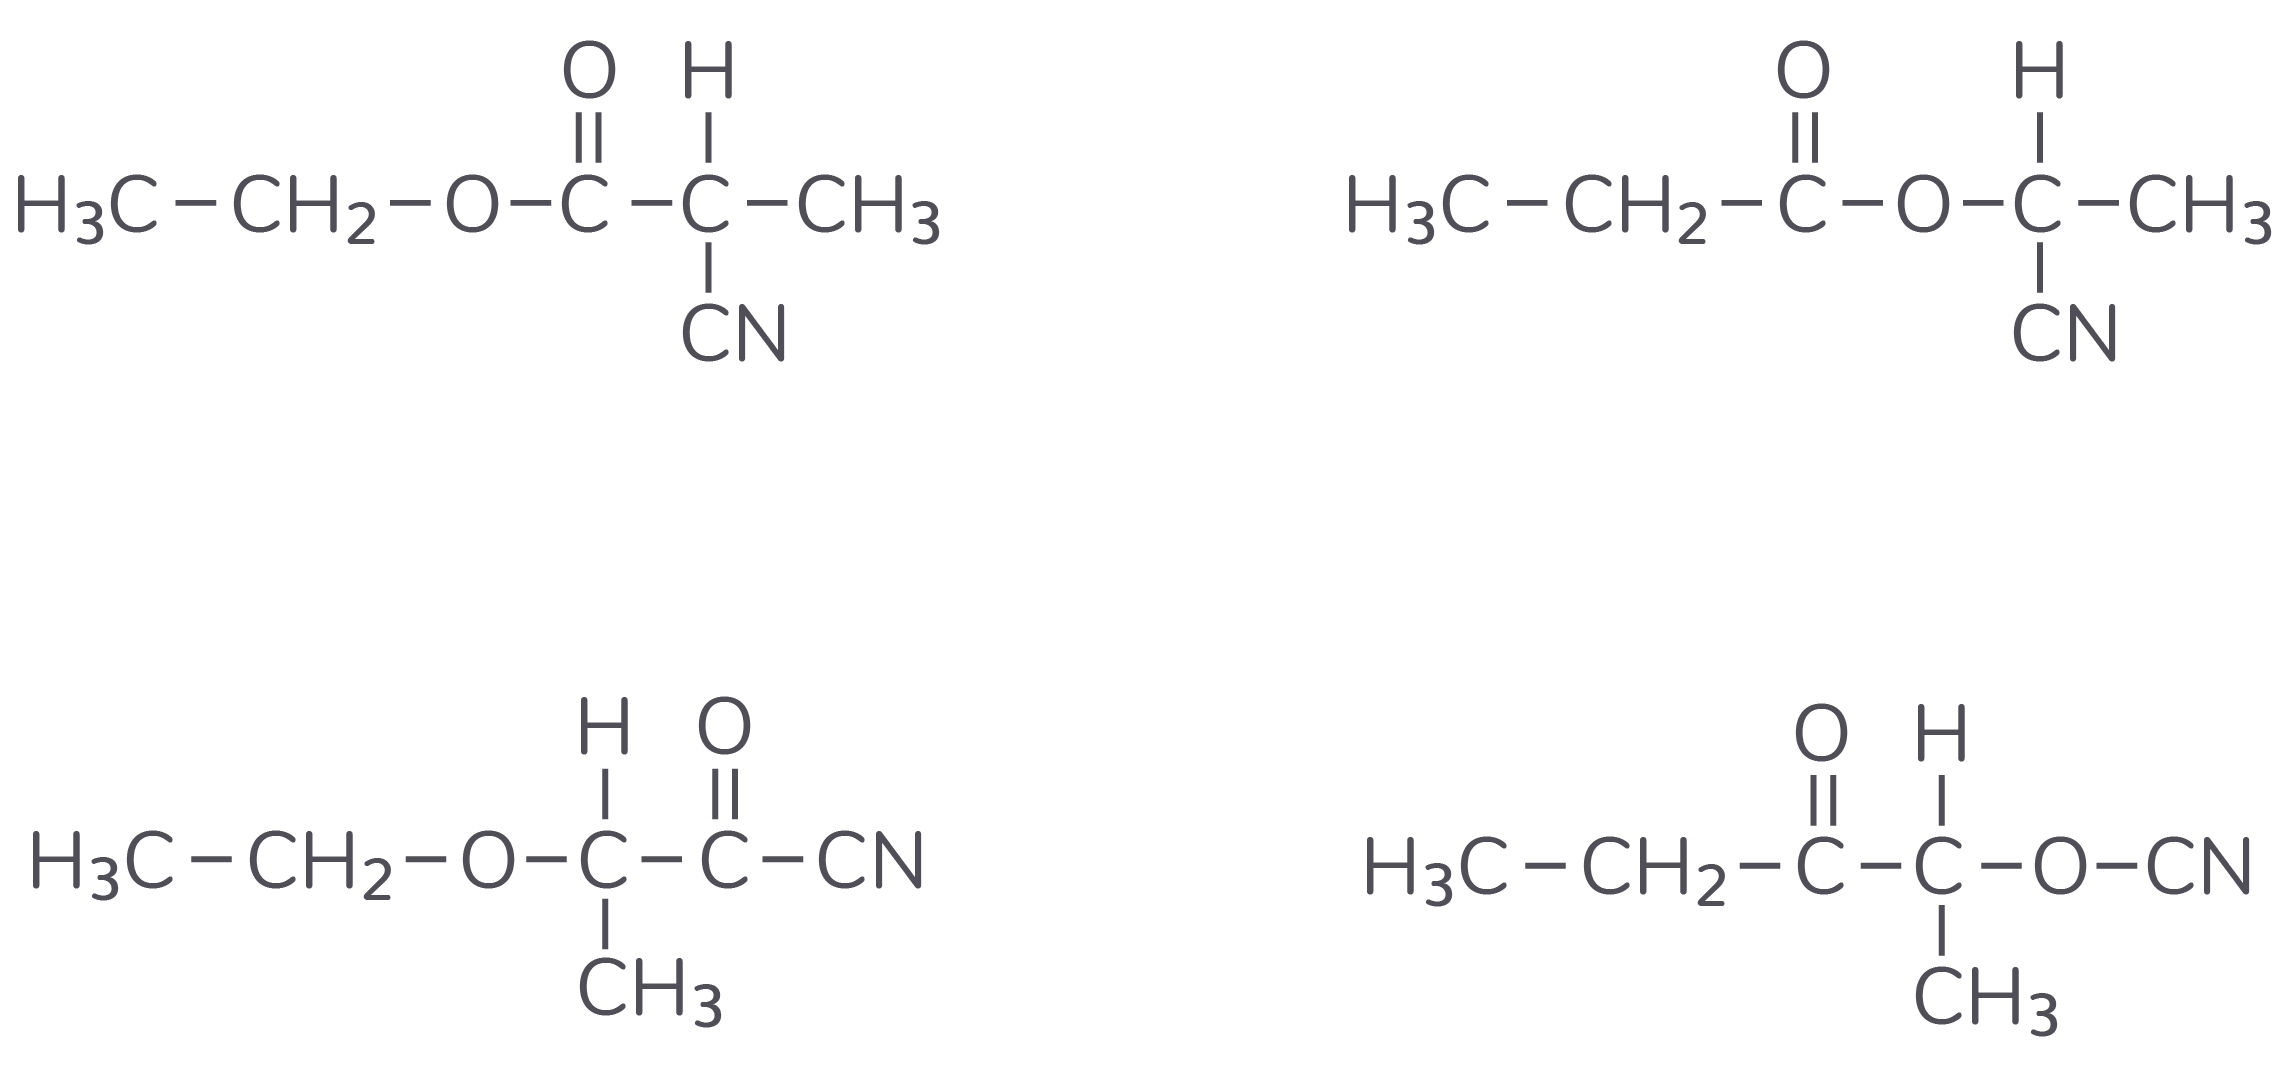
The diagram below shows the structures of four isomers with the molecular formula C6H12O2.
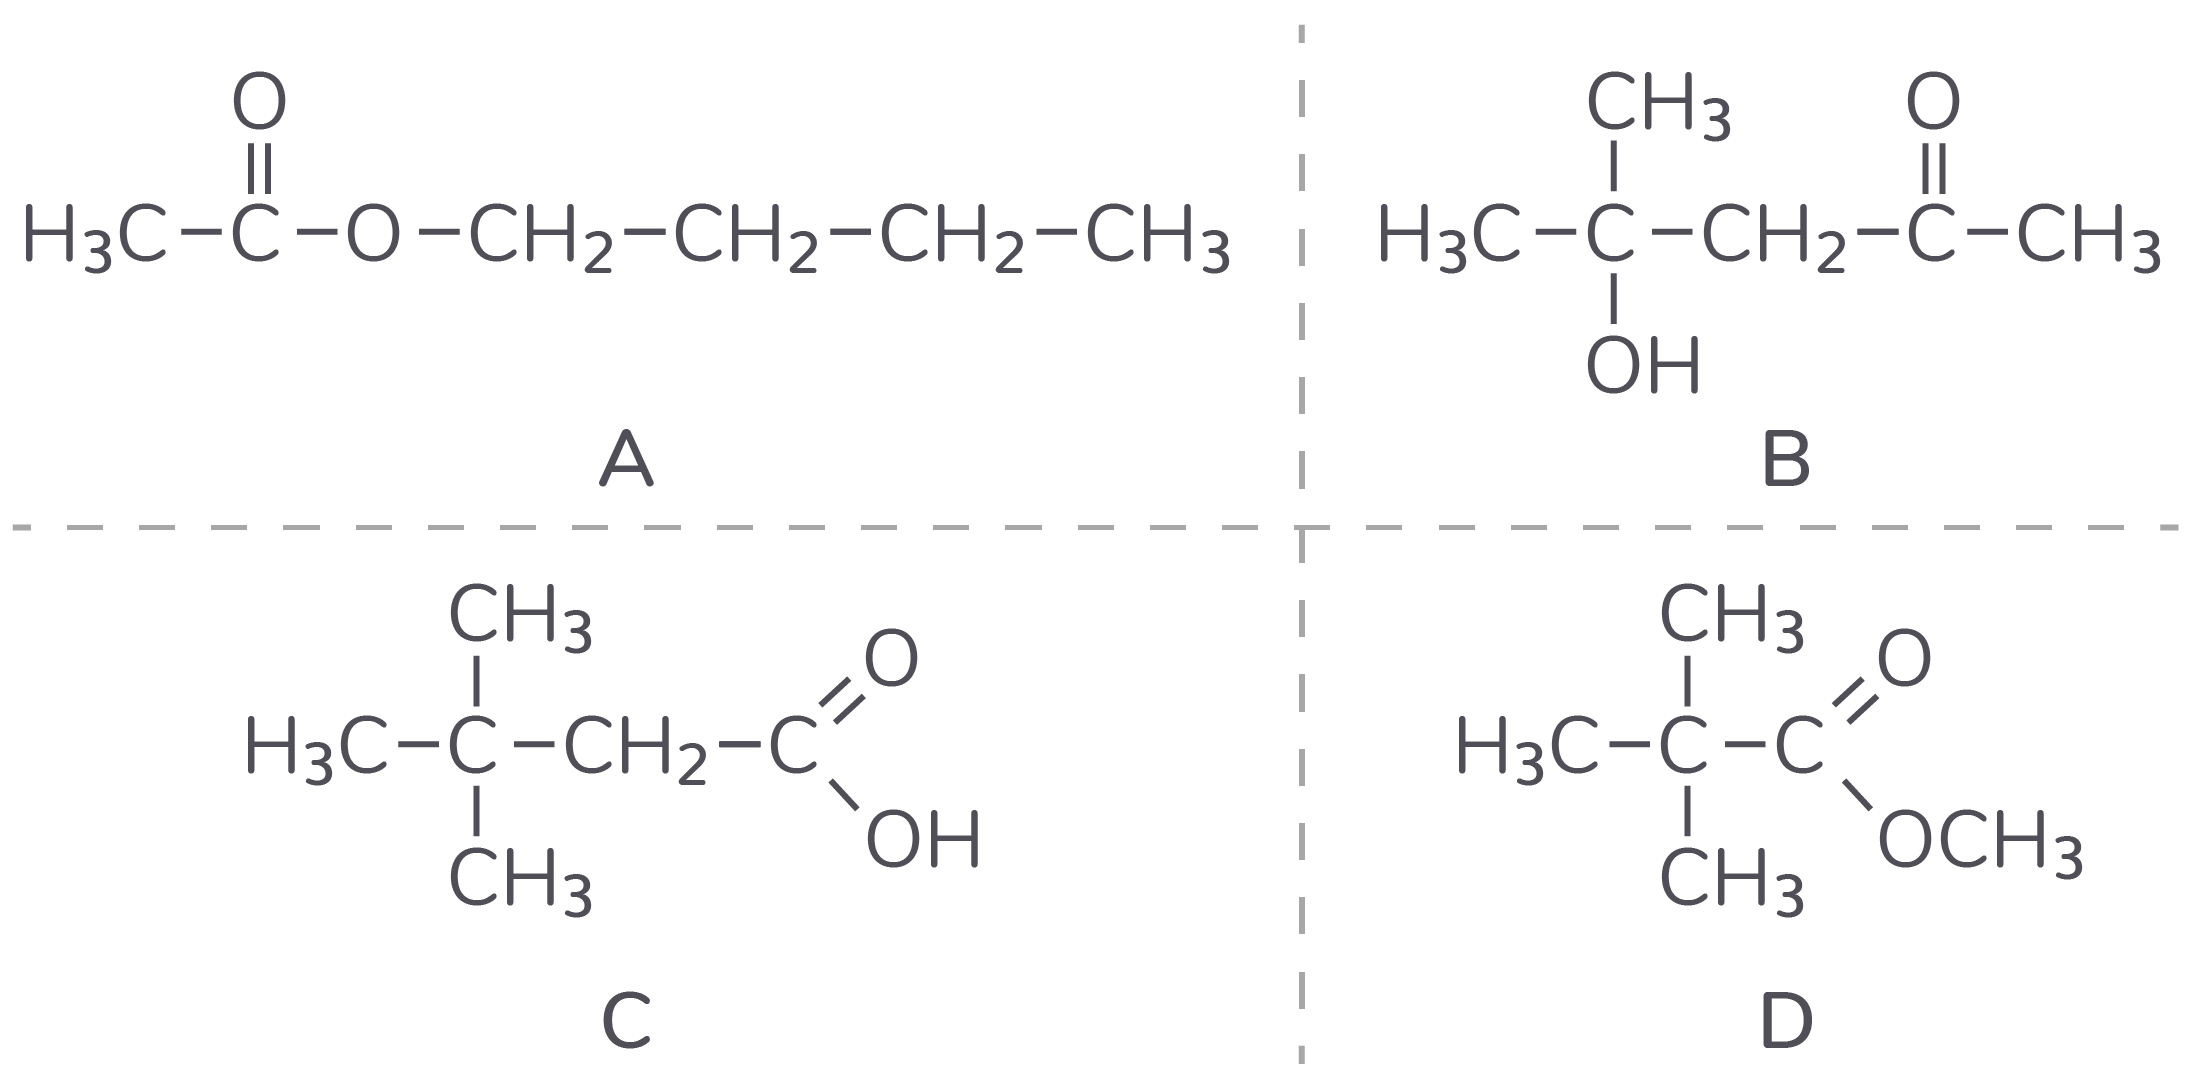
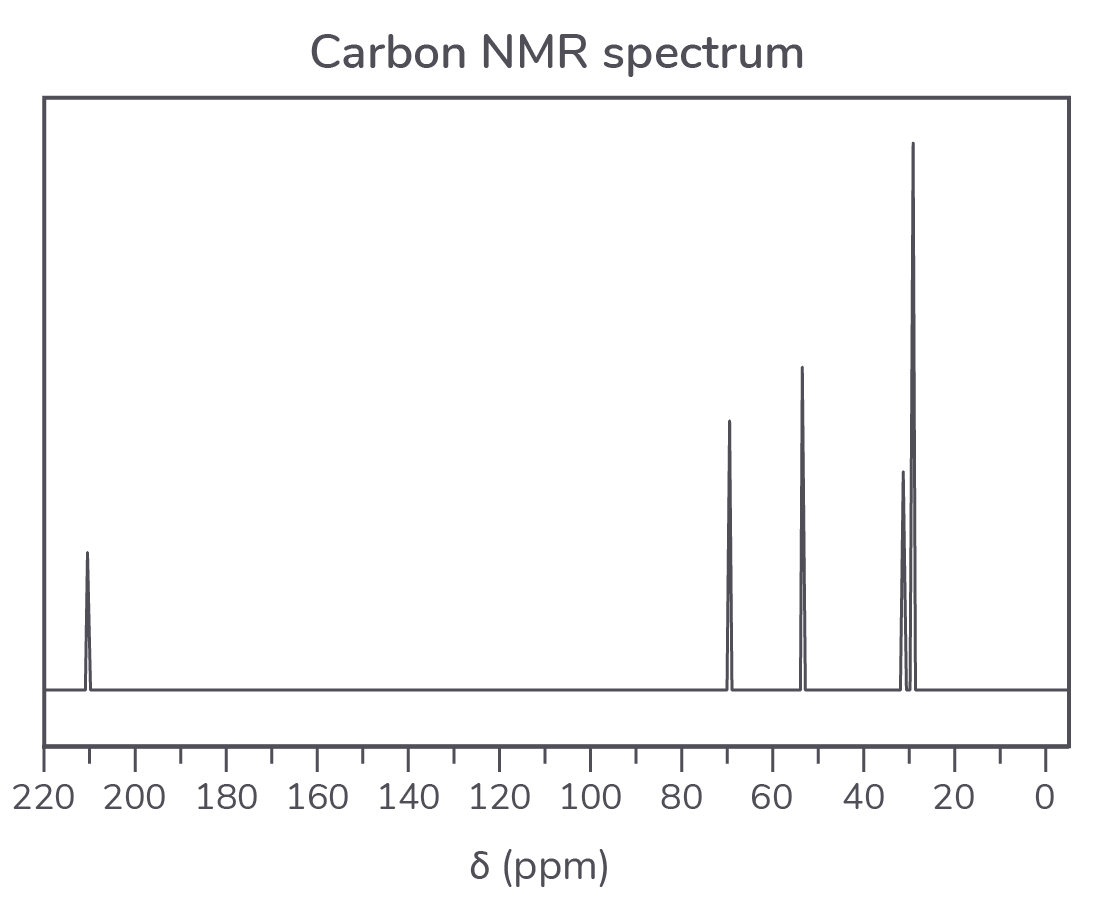
Identify which of the isomers shown in the diagram above would produce the 13C NMR spectrum shown below.
Justify your answer.
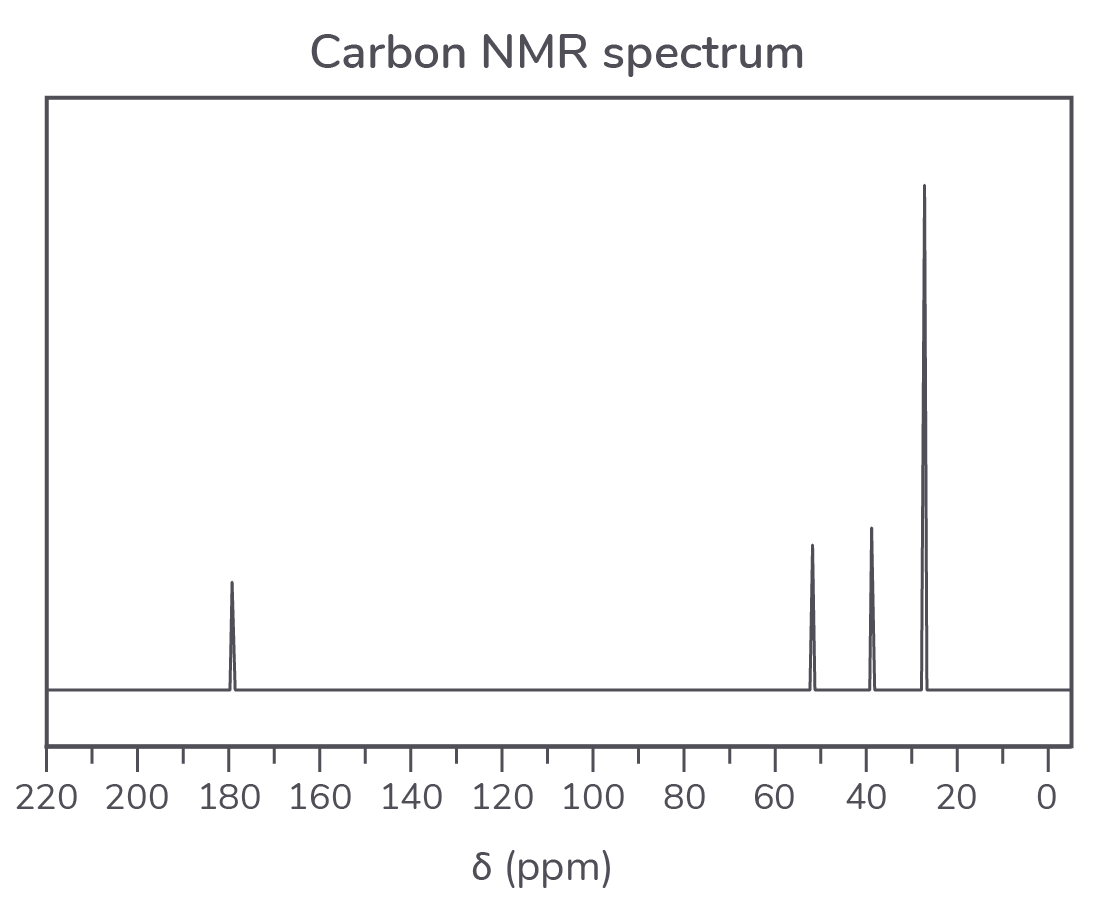
Identify which of the isomers shown in the diagram above would produce the 13C NMR spectrum shown below.
Justify your answer.
How many peaks would be observed in the 13C spectrum of 1,4-dimethylbenzene?
Gas chromatography is an analytical technique used to separate mixtures into their individual components.
Define the term retention time as applied to gas chromatography.
What is the role of the gas in gas chromatography?
Sketch a chromatogram on the axes below showing a mixture containing two components.
Organic compound X is analysed by a combination of techniques.
Elemental analysis:
C: 56.69%; H: 7.09%; N: 11.02%; O: 25.20%
Mass spectrum:
Molecular ion peak at m/z = 127.0
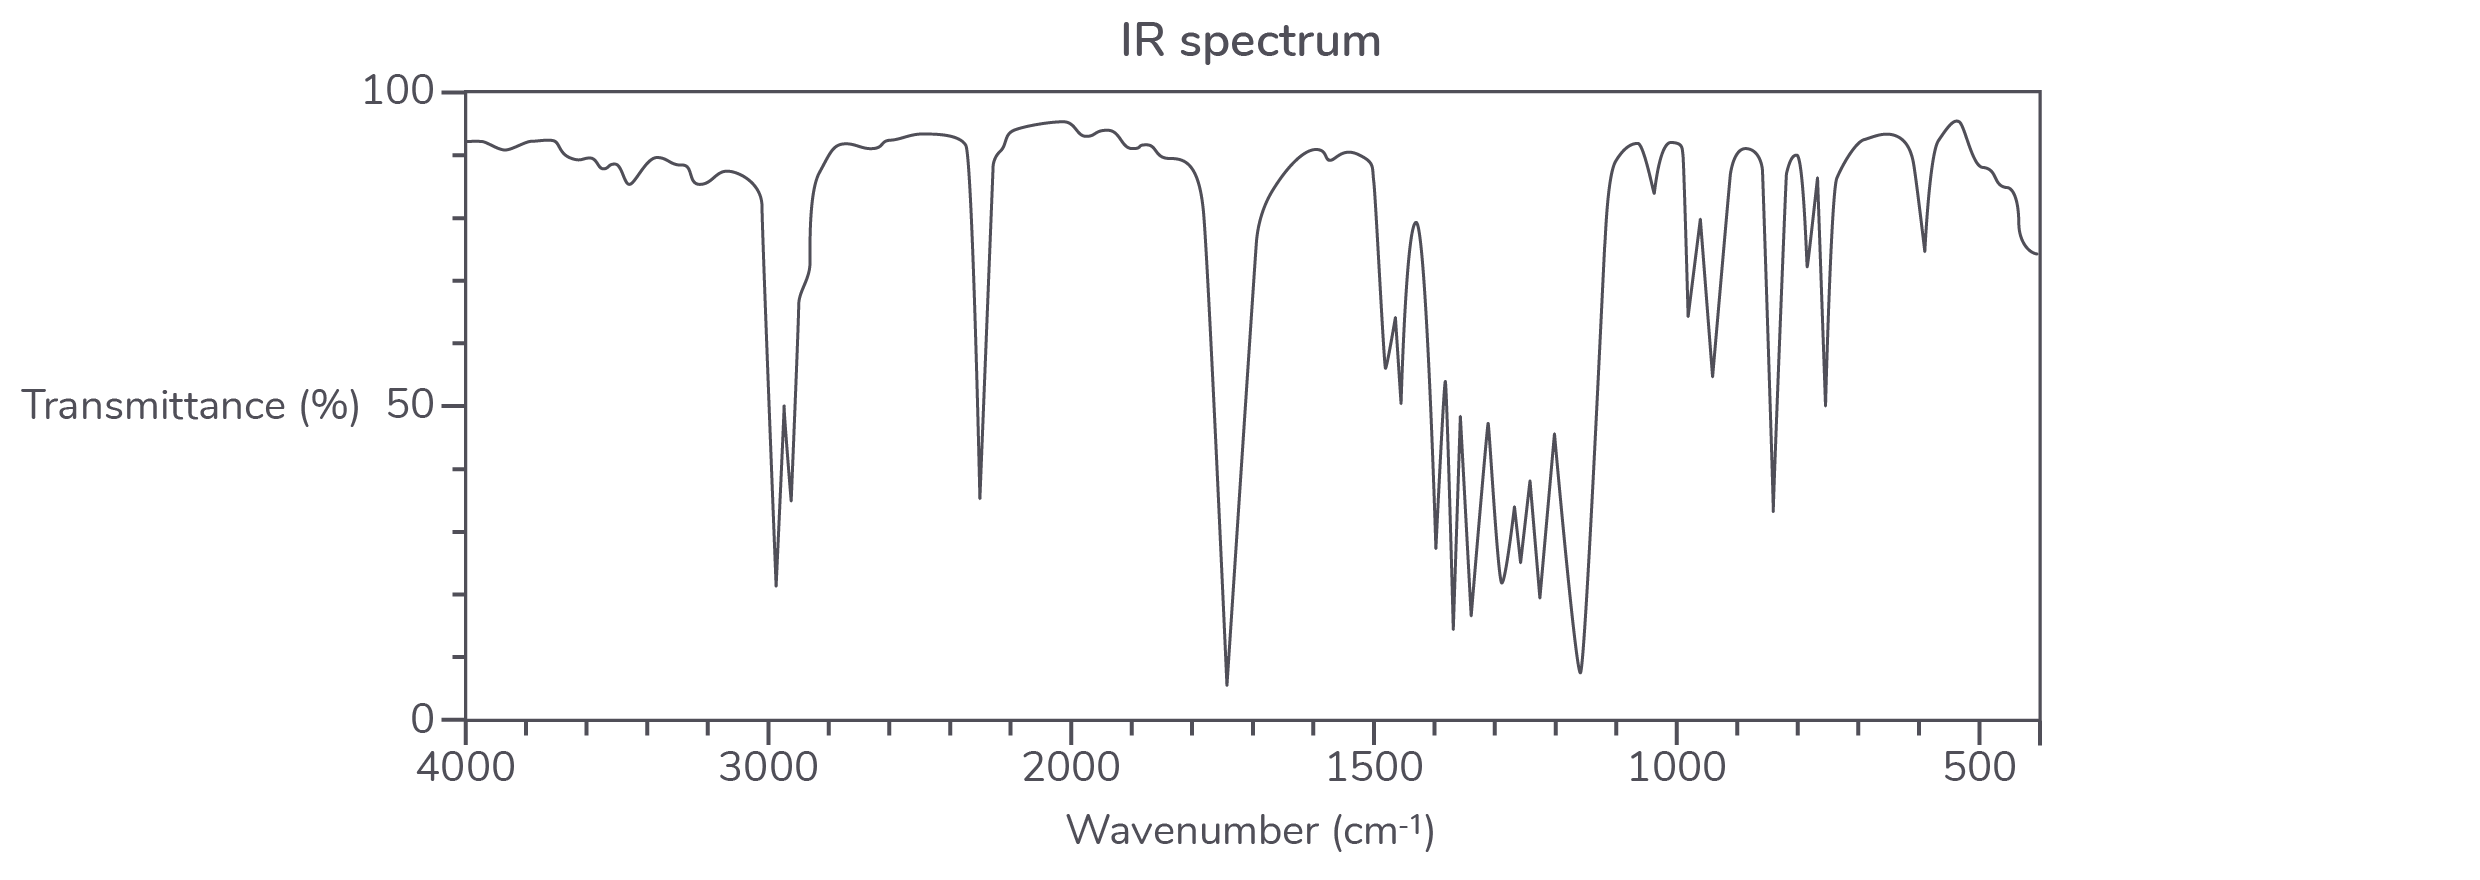
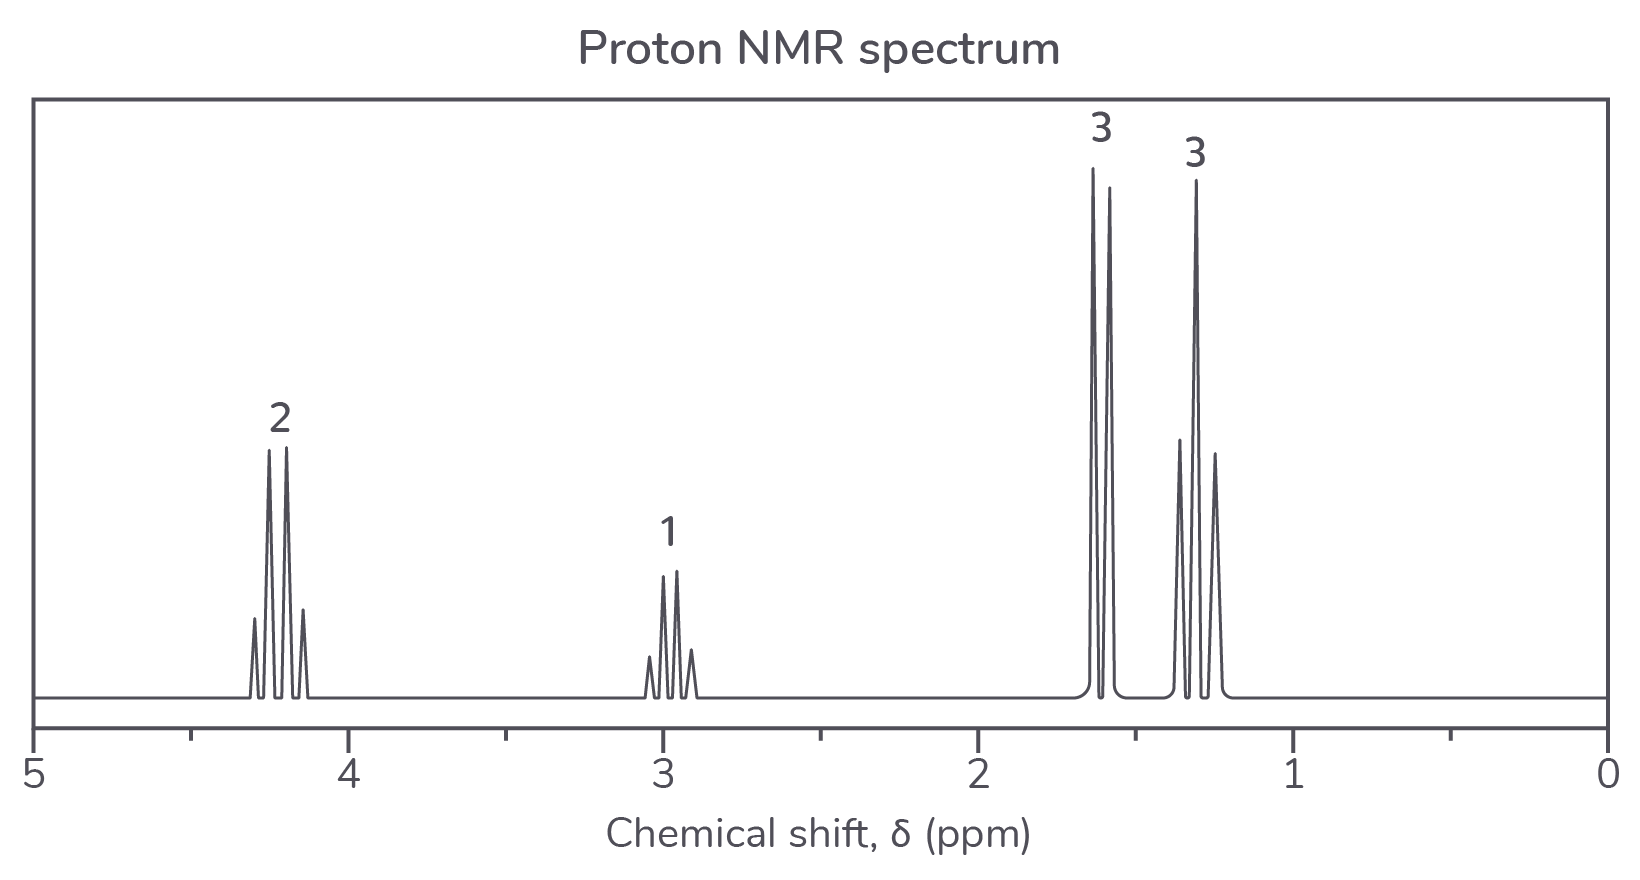
Use all the data to identify compound X explaining your reasoning.
The diagram below shows the structure of an ester with four different carbon environments.
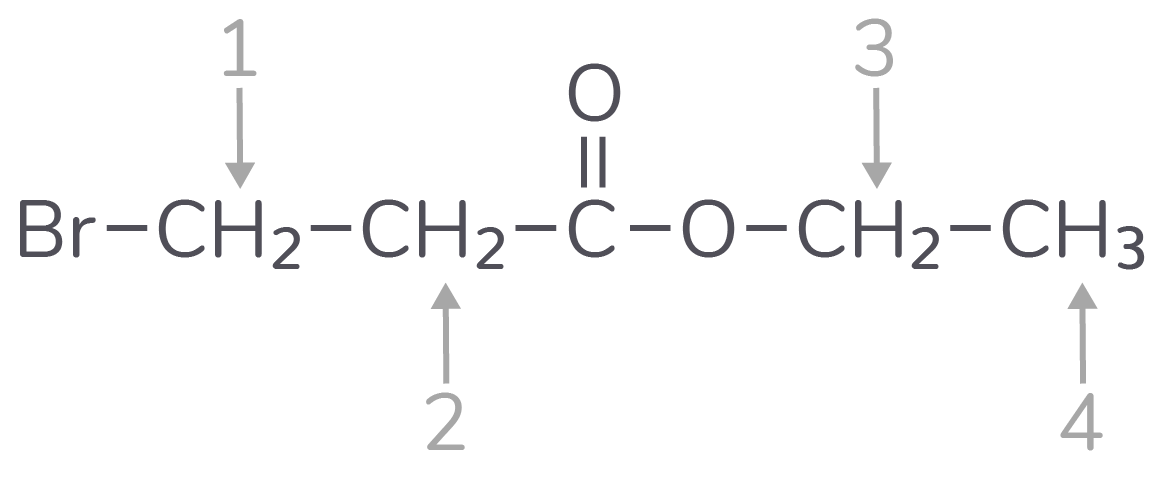
Complete the table below to predict the proton NMR spectrum of the ester.
Compound W is an isomer of the ester in part a). Compound W reacts with aqueous sodium carbonate and its 13C NMR spectrum has 4 peaks.
Draw a possible structure of compound W.
The diagram below shows the 1H NMR spectrum of a compound known to be either propan-1-ol, propanal or propanoic acid.
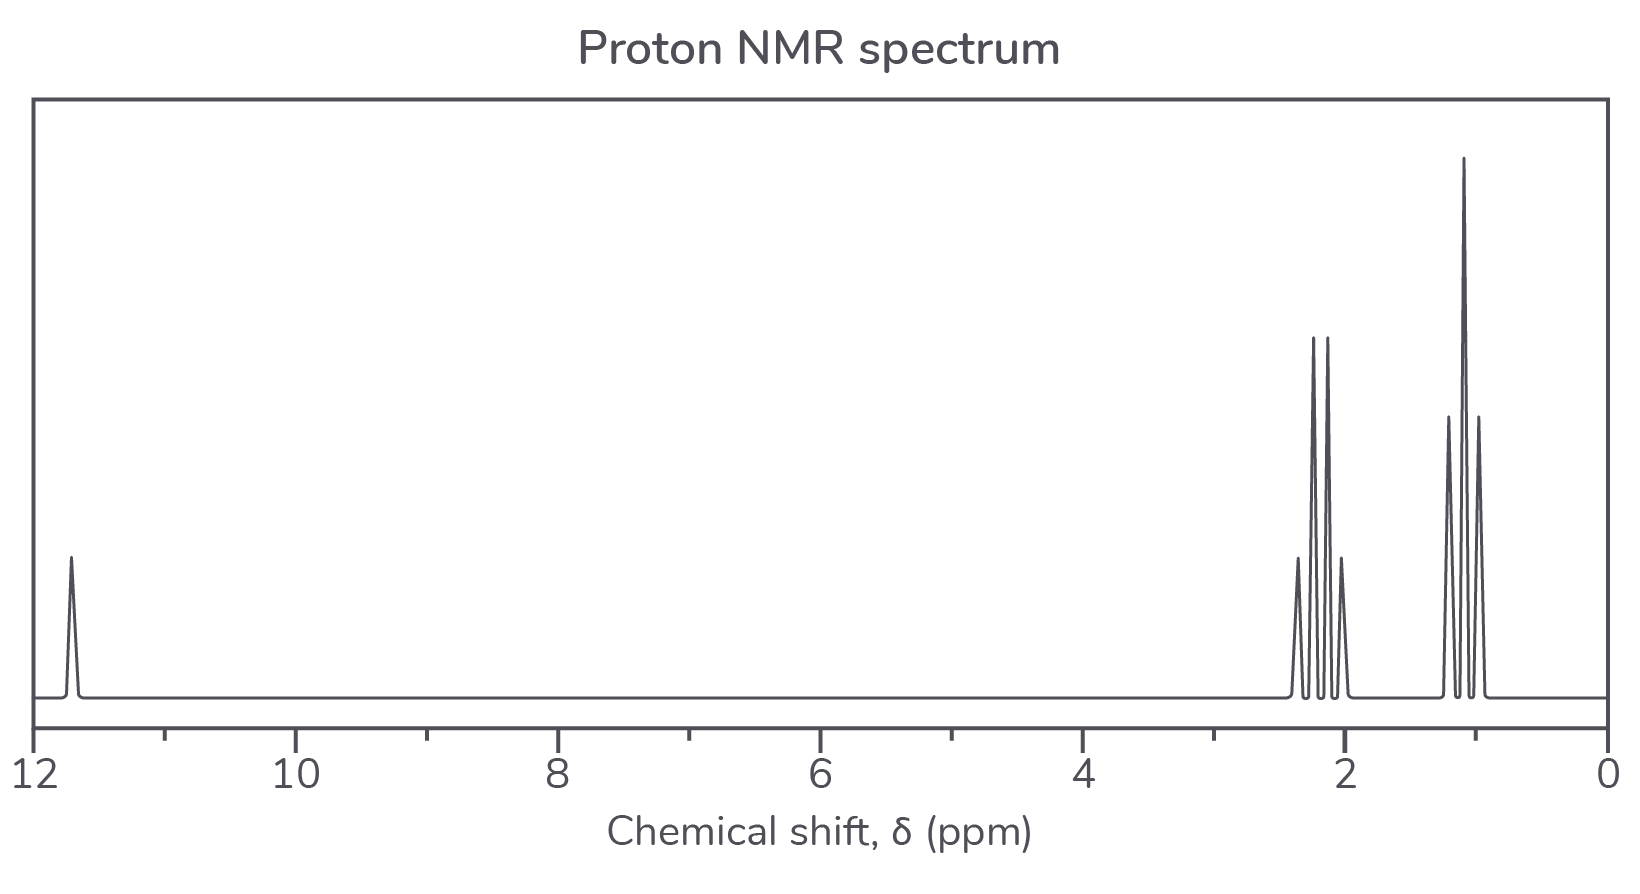
Identify the compound from its proton NMR spectrum, justifying your answer.
The diagram below shows the structures of 2-nitrophenol, 3-nitrophenol and 4-nitrophenol.
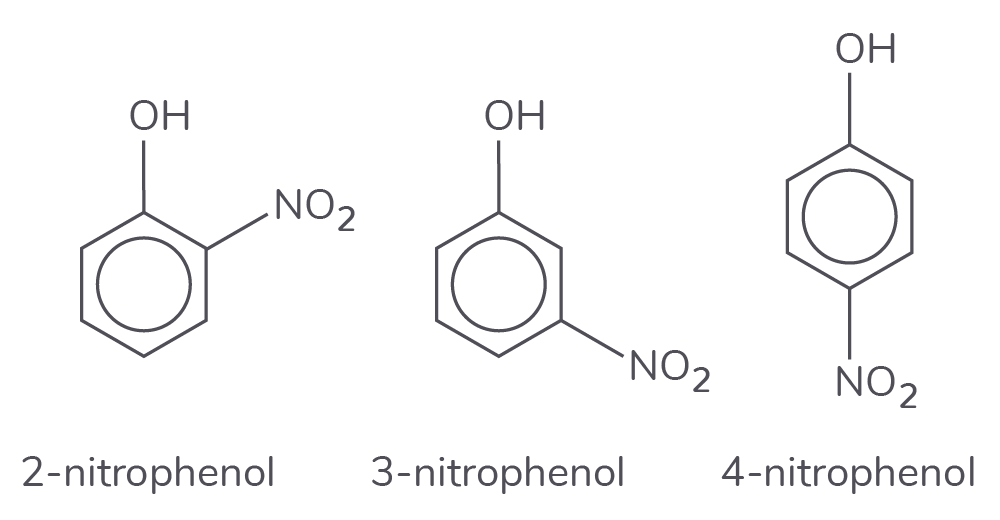
Explain whether 13C NMR spectroscopy can be used to distinguish between these three compounds.
The diagram below shows the structure of the aromatic compound benzocaine.
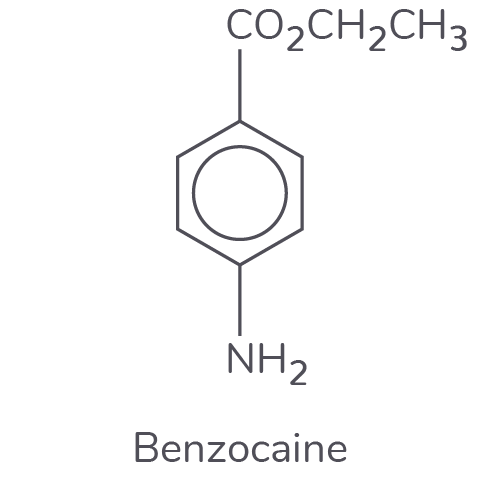
Predict the number of peaks seen in the 13C NMR spectrum.
The diagram below shows the 1H NMR spectrum of benzocaine dissolved in CDCl3.
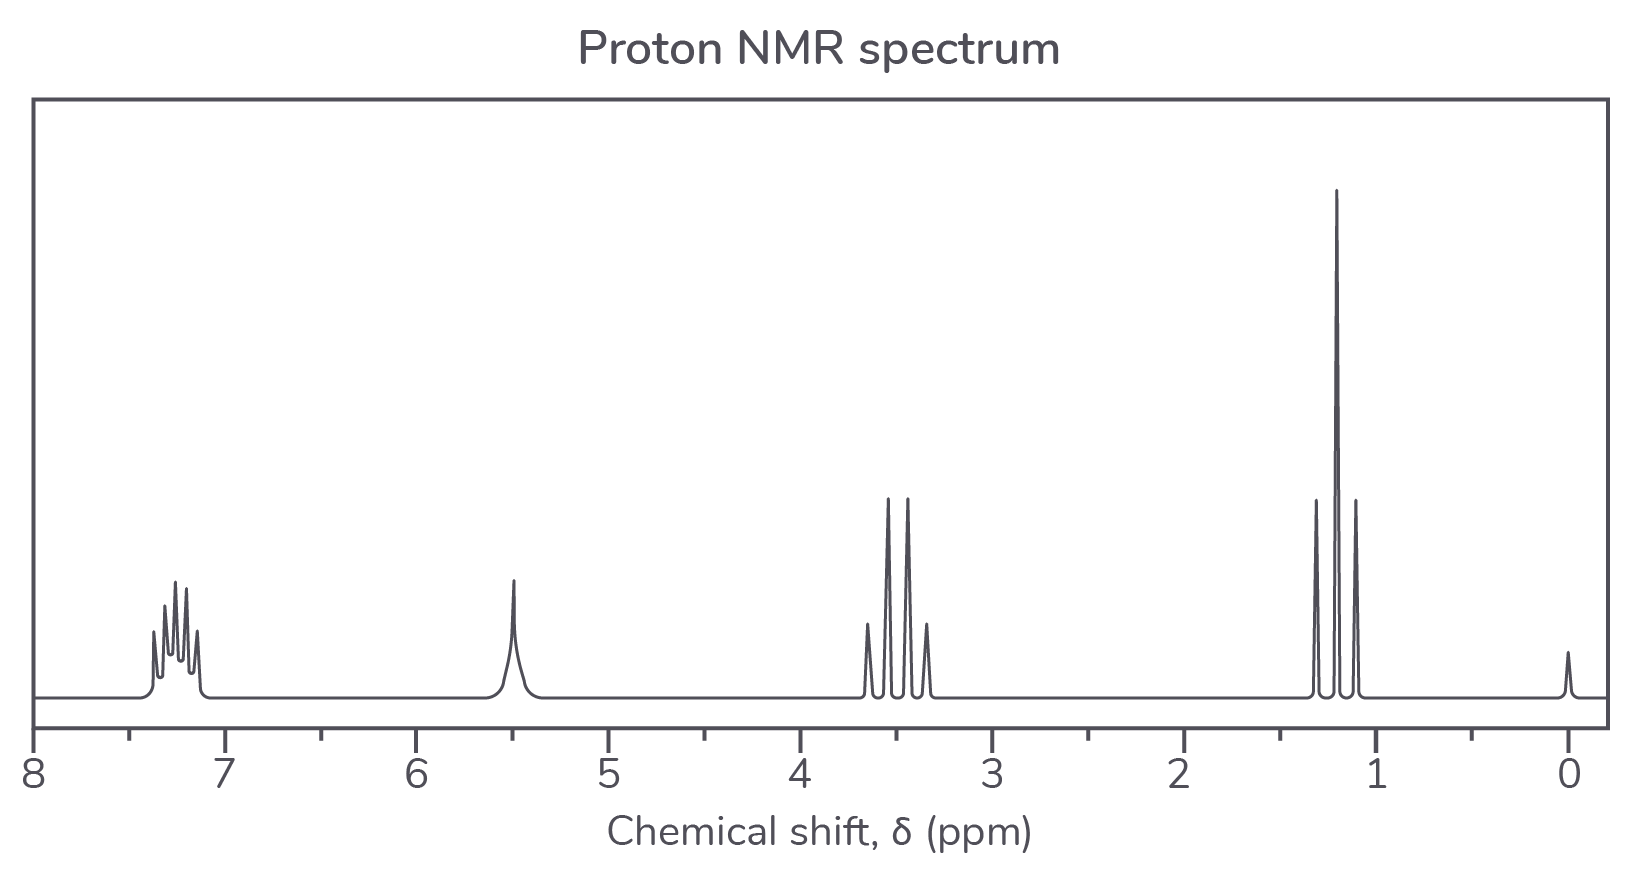
Complete the table below for the NMR data of benzocaine.
Organic compound X contains only carbon, hydrogen and nitrogen and is analysed by a combination of techniques.
Elemental analysis:
C: 74.17%; H: 11.41%; N: 14.42%
Mass spectrum:
Molecular ion peak at m/z = 97.0
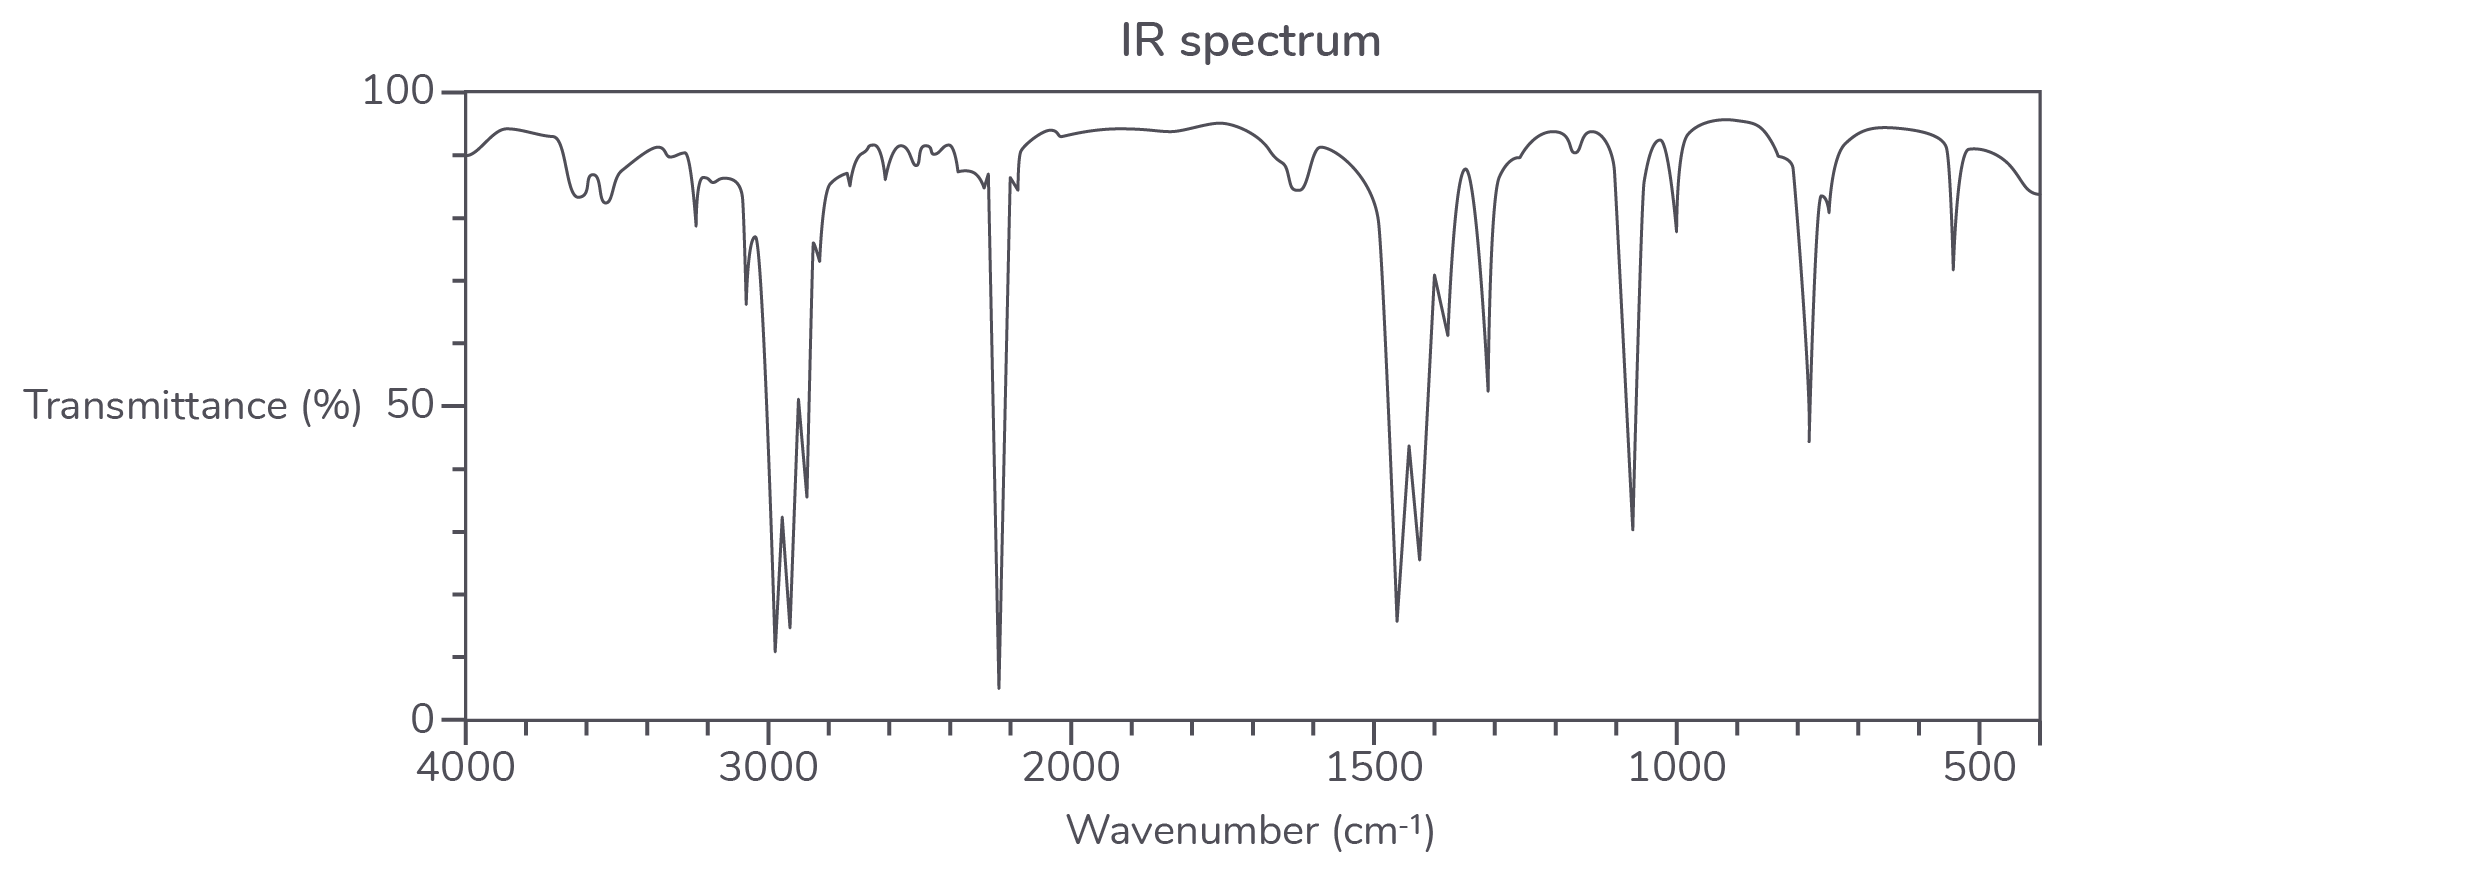
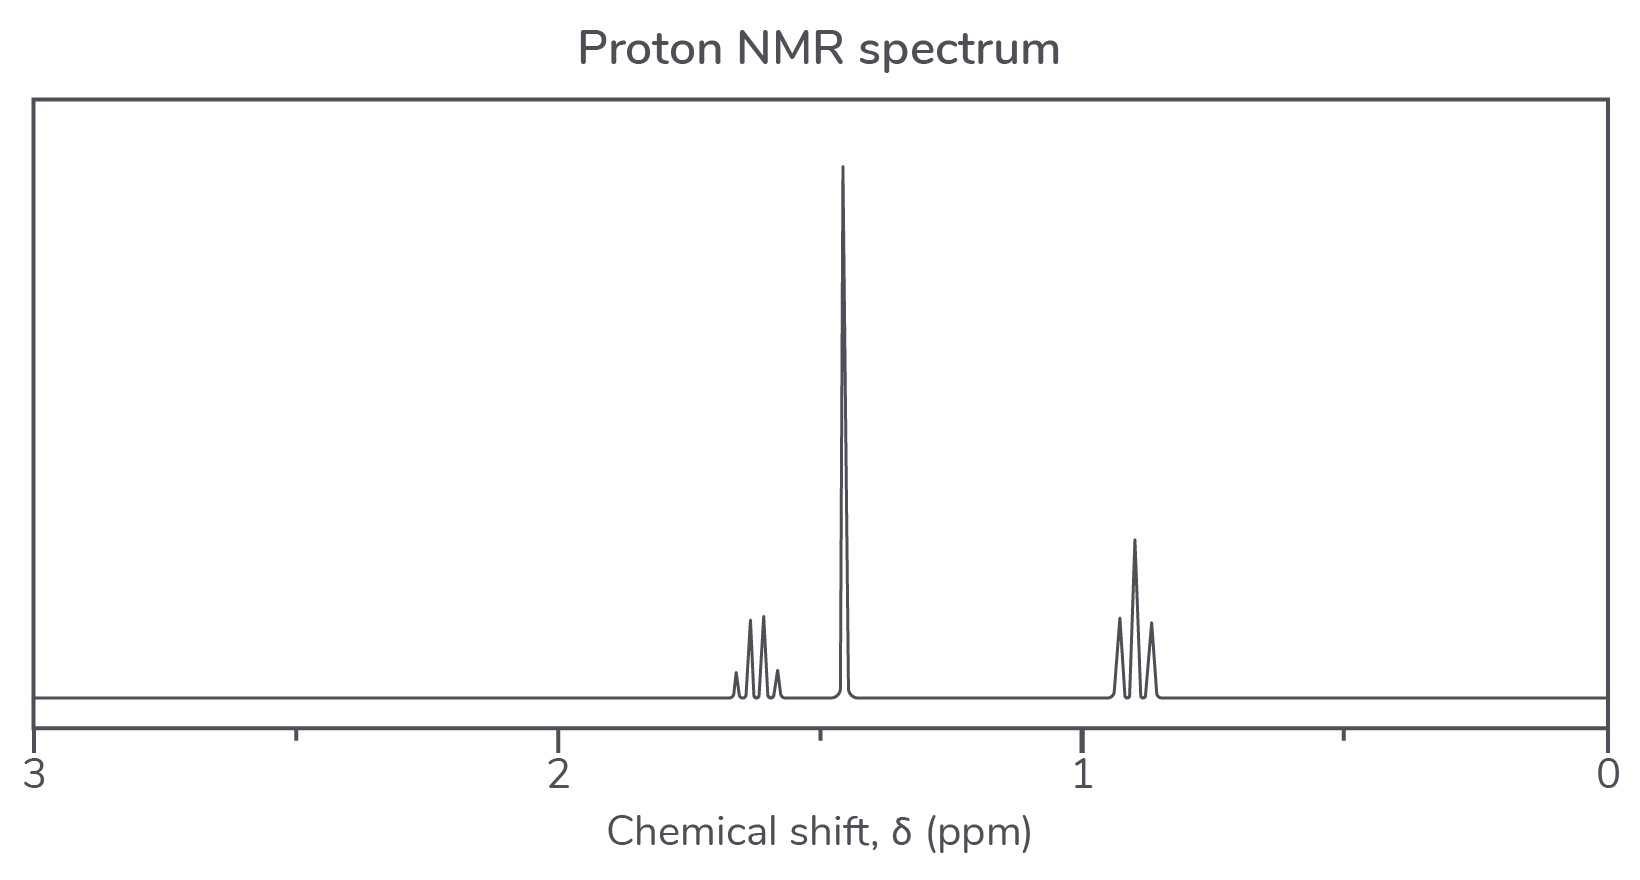
Use all the data to identify compound X explaining your reasoning.
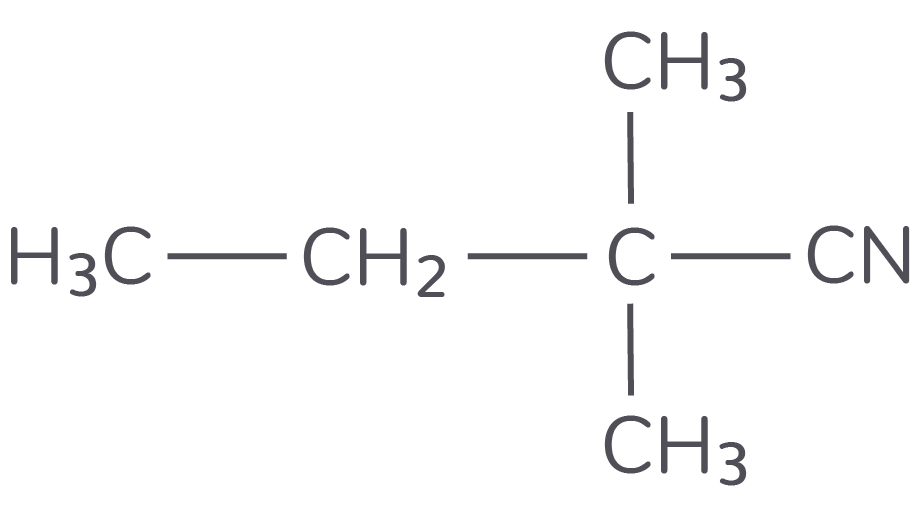
This question is about 1H NMR spectroscopy.
A compound is mixed with tetramethylsilane (TMS) before the 1H NMR spectrum is obtained.
State and explain why TMS is used in NMR spectroscopy.
State the splitting pattern that would be observed in the 1H NMR spectrum for each of the peaks given by the hydrogen atoms, labelled x, y and z, of the compound shown in the diagram below.
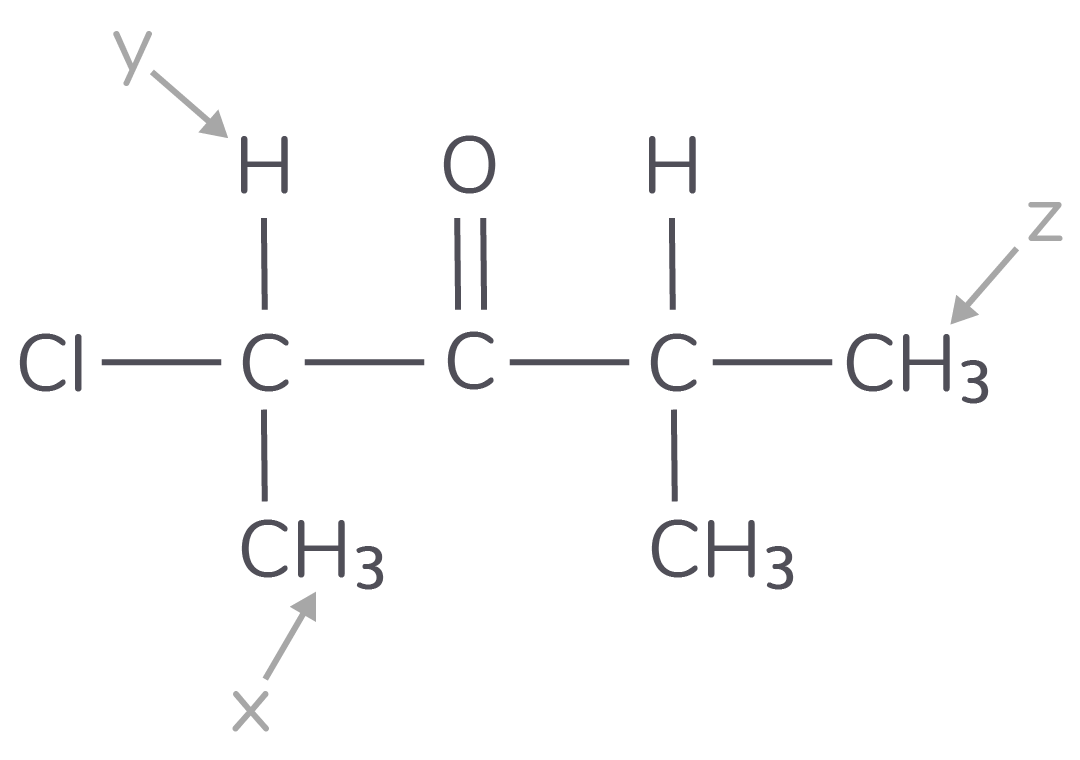
An isomer of the compound in part b) has only two singlet peaks in its 1H NMR spectrum. The integration ratio is 2:9.
Draw the structure of this isomer.
A sample of a tripeptide was hydrolysed and then placed on a thin layer chromatography (TLC) plate. Samples of possible amino acids present were also placed on the TLC plate for reference.
A simplified diagram of the developed TLC plate is shown.
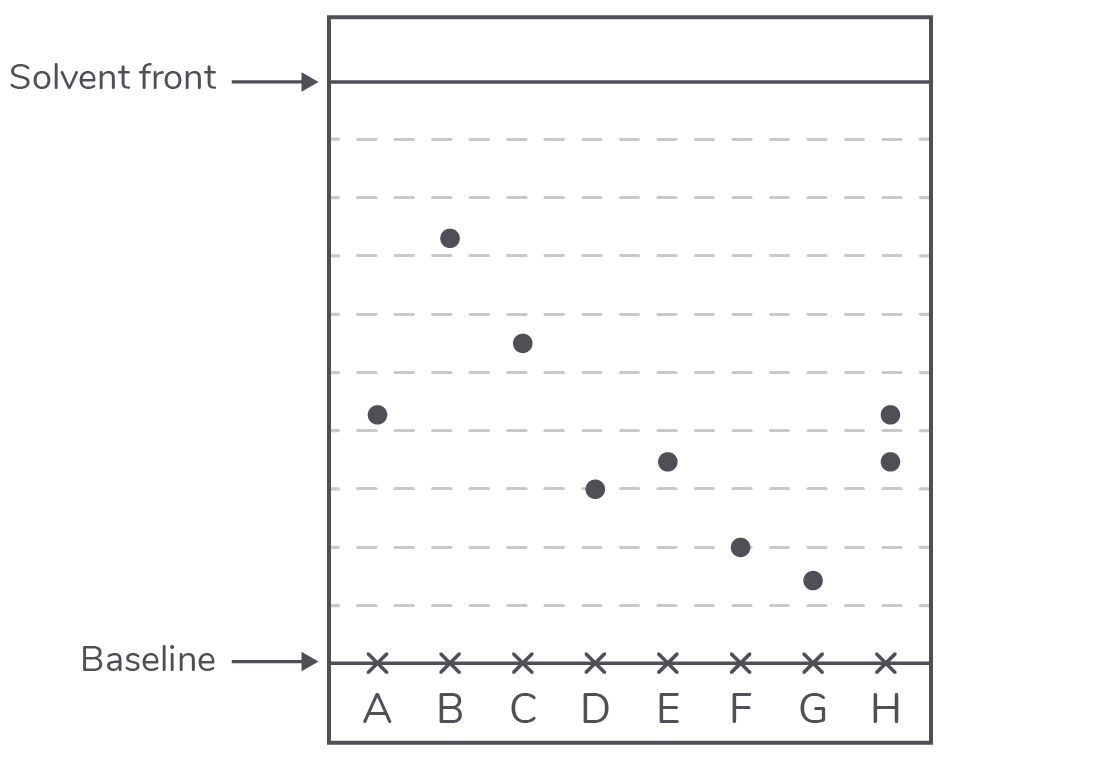
| TLC sample spot | Compound |
|---|---|
| A | Serine |
| B | Histidine |
| C | Proline |
| D | Methionine |
| E | Tyrosine |
| F | Lysine |
| G | Isoleucine |
| H | Hydrolysed tripeptide |
Calculate the Rf value for the amino acid lysine.
Give your answer to 2 decimal places.
Identify by name the two amino acids present in the tripeptide, giving a reason for the lack of a third spot.
Give two reaons why different amino acids have different Rf values.
In chromatography, a 'locating' reagent is often used when the components in a mixture are colourless.
Which reagent is used to locate the amino acid spots?
Gas chromatography can be used both to separate the components in a mixture and to determine the amount of each present.
State why argon and nitrogen are suitable carrier gases for gas chromatography.
A mixture containing one part substance X, two parts substance Y and one part substance Z was separated by gas chromatography.
Substance X has a retention time of 10 seconds, substance Y of 25 seconds and substance Z of 50 seconds.
Complete the sketch of this chromatogram.
The compound ethyl 3-oxobutanoate, which is used in food flavouring, has the formula CH3COCH2COOCH2CH3.
The carbon-13 (13C) NMR spectrum of ethyl 3-oxobutanoate has six peaks.
Draw the structural formula of an isomer of ethyl 3-oxobutanoate that contains a carboxylic acid group and a ketone functional group, but only has four peaks in its carbon-13 NMR spectrum.
A chemist synthesising ethyl 3-oxobutanoate looked for its presence in the reaction mixture using thin-layer chromatography. The solvent used was a mixture of ethoxyethane, C2H5OC2H5, which is polar, and hexane.
Under these conditions, the Rf value for ethyl 3-oxobutanoate was 0.45.
Complete the diagram below, showing a chromatogram for ethyl 3-oxobutanoate, including appropriate labels.
Suggest why the Rf value for ethyl 3-oxobutanoate is significantly lower than 0.45 when just hexane is used as the solvent.