16.1 - Reaction Rates and Orders of Reactions
- 1
Defining reaction rate and methods for measurement
- 2
What a rate equation is
- 3
How orders of reaction relate to reactant concentrations
- 4
What the rate constant (k) represents
- 5
Interpreting rate-concentration graphs
- 6
Calculating rate constants from half-life data
Reaction rate measures the speed of a chemical change
The reaction rate measures how quickly reactants are used up or products are formed during a chemical reaction. It is defined as the change in the amount of reactants or products per unit time. Typically, it is expressed in units of mol dm-3 s-1.
Various methods can be used to monitor reaction rates
To measure a reaction rate, you need to observe a property that changes as the reaction proceeds. Several continuous monitoring methods are used:
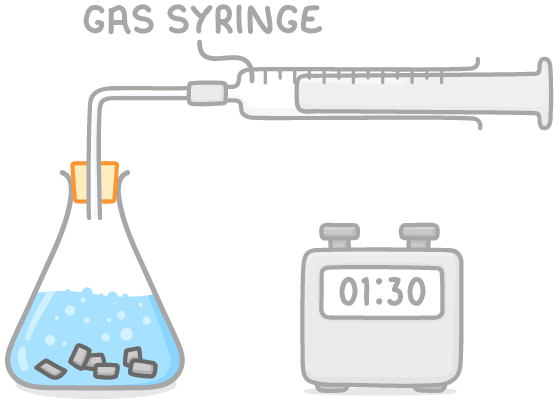
- Measuring gas volume
- If a gas is produced, it can be collected in a gas syringe.
- Record the volume of gas at regular intervals (e.g., every 15 seconds).
- Convert gas volume to moles using the ideal gas equation, then determine reactant concentration using stoichiometry.
- Measuring mass change
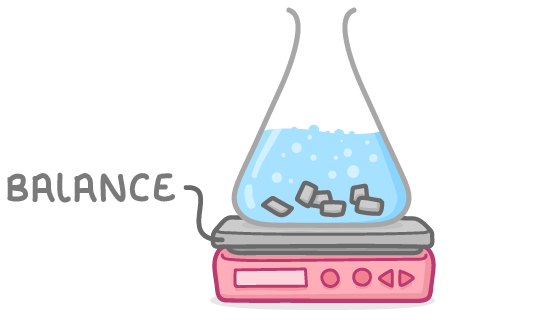
- If a gas is released, the reaction system will lose mass.
- Measure the mass at regular intervals using a balance.
- Calculate moles of gas lost and remaining reactant concentration using mole calculations.
- Tracking colour change
- A colorimeter measures the absorbance (light absorption) of a solution.
- More concentrated coloured solutions have higher absorbance.
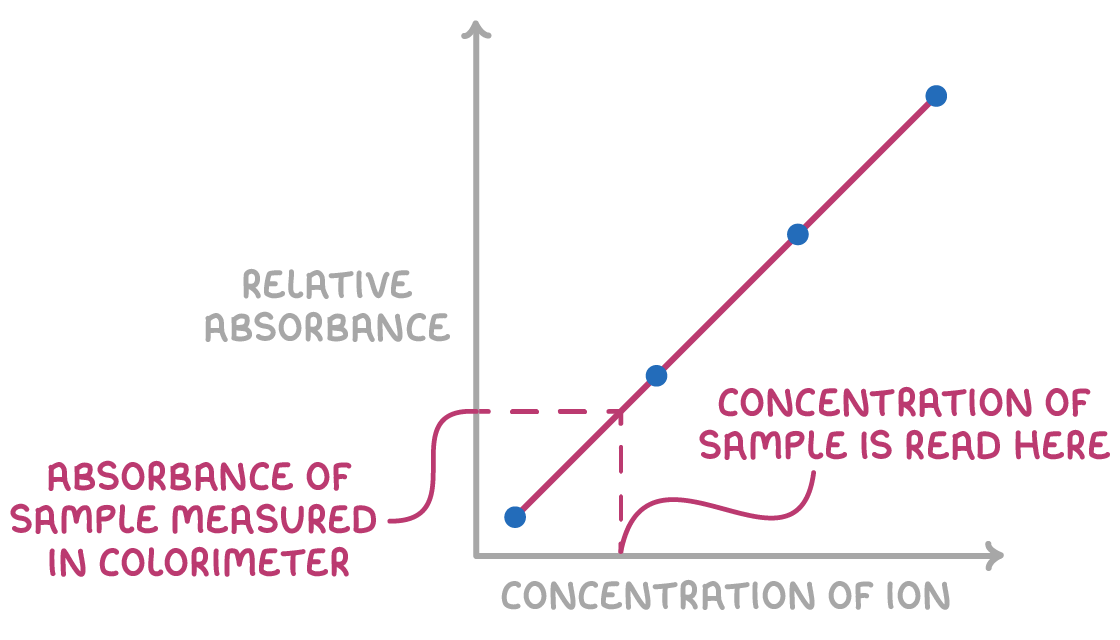
- Create a calibration curve by plotting known concentrations against absorbance.
- During the reaction, measure absorbance of samples at regular intervals.
- Determine sample concentrations using the calibration curve by locating their absorbance on the y-axis and reading the corresponding concentration from the x-axis.
- Monitoring pH changes
- If H+ ions are produced or consumed, the pH of the solution will change.
- Measure pH at regular intervals and calculate [H+] using the relationship: pH = log[H+].
- Performing titrations
- Take small samples of the reaction mixture at regular intervals.
- Titrate each sample with a standard solution.
- Calculate reactant or product concentration from titration data.
- Measuring electrical conductivity
- Changes in the number of ions in solution affect electrical conductivity.
- Measure conductivity at regular intervals to track the progress of the reaction.
Rate equations relate reaction rate to reactant concentrations
A rate equation is a mathematical expression that shows how the rate of a chemical reaction depends on the concentrations of the reactants.
For a general reaction: A + B ➔ C + D
The rate equation takes the form:
Rate = k[A]m[B]n
Where:
- Rate is the reaction rate (mol dm-3 s-1).
- k is the rate constant.
- [A] and [B] are the concentrations of reactants A and B (mol dm-3).
- m and n are the orders of reaction with respect to A and B.
Reaction orders show how reactant concentrations affect the rate
The values of m and n in the rate equation are the reaction orders with respect to each reactant.
They indicate how changing the concentration of a reactant influences the reaction rate.
-
Zero order (m or n = 0) - The rate is independent of the reactant concentration. Doubling or tripling the concentration has no effect on the rate. [A]0 = 1, so zero order terms are often written without the concentration term.
-
First order (m or n = 1) - The rate is directly proportional to the reactant concentration. Doubling the concentration doubles the rate, tripling the concentration triples the rate.
-
Second order (m or n = 2) - The rate is proportional to the square of the reactant concentration. Doubling the concentration quadruples the rate (22 = 4), tripling the concentration increases the rate ninefold (32 = 9).
The overall order of the reaction is the sum of m and n.
Importantly, reaction orders can only be determined experimentally, not from balanced chemical equations.
The rate constant k relates reactant concentrations to rate at a given temperature
The rate constant, k, is a proportionality constant that relates the rate of a reaction to the concentrations of the reactants at a specific temperature.
- A larger k value indicates a faster rate of reaction.
- k remains constant for a given reaction at a fixed temperature.
- Increasing the temperature exponentially increases the value of k, as collisions between reactant molecules are more frequent and more energetic.
The units of k depend on the overall order of the reaction.
Determining reaction order from rate-concentration graphs
The shape of a rate-concentration graph can reveal the reaction order with respect to a particular reactant.
To construct a rate-concentration graph from experimental data, follow these steps:
-
Begin with a concentration-time graph for the reactant of interest.
-
Calculate the rate (gradient) at various points along the concentration-time curve.
- For linear plots, the gradient is constant and can be easily determined.
- For curved plots, draw tangent lines at selected points to determine the gradient at each point.
-
Plot the rate (y-axis) against the corresponding concentration (x-axis) for each point.
-
Fit a smooth curve or line through the resulting data points.
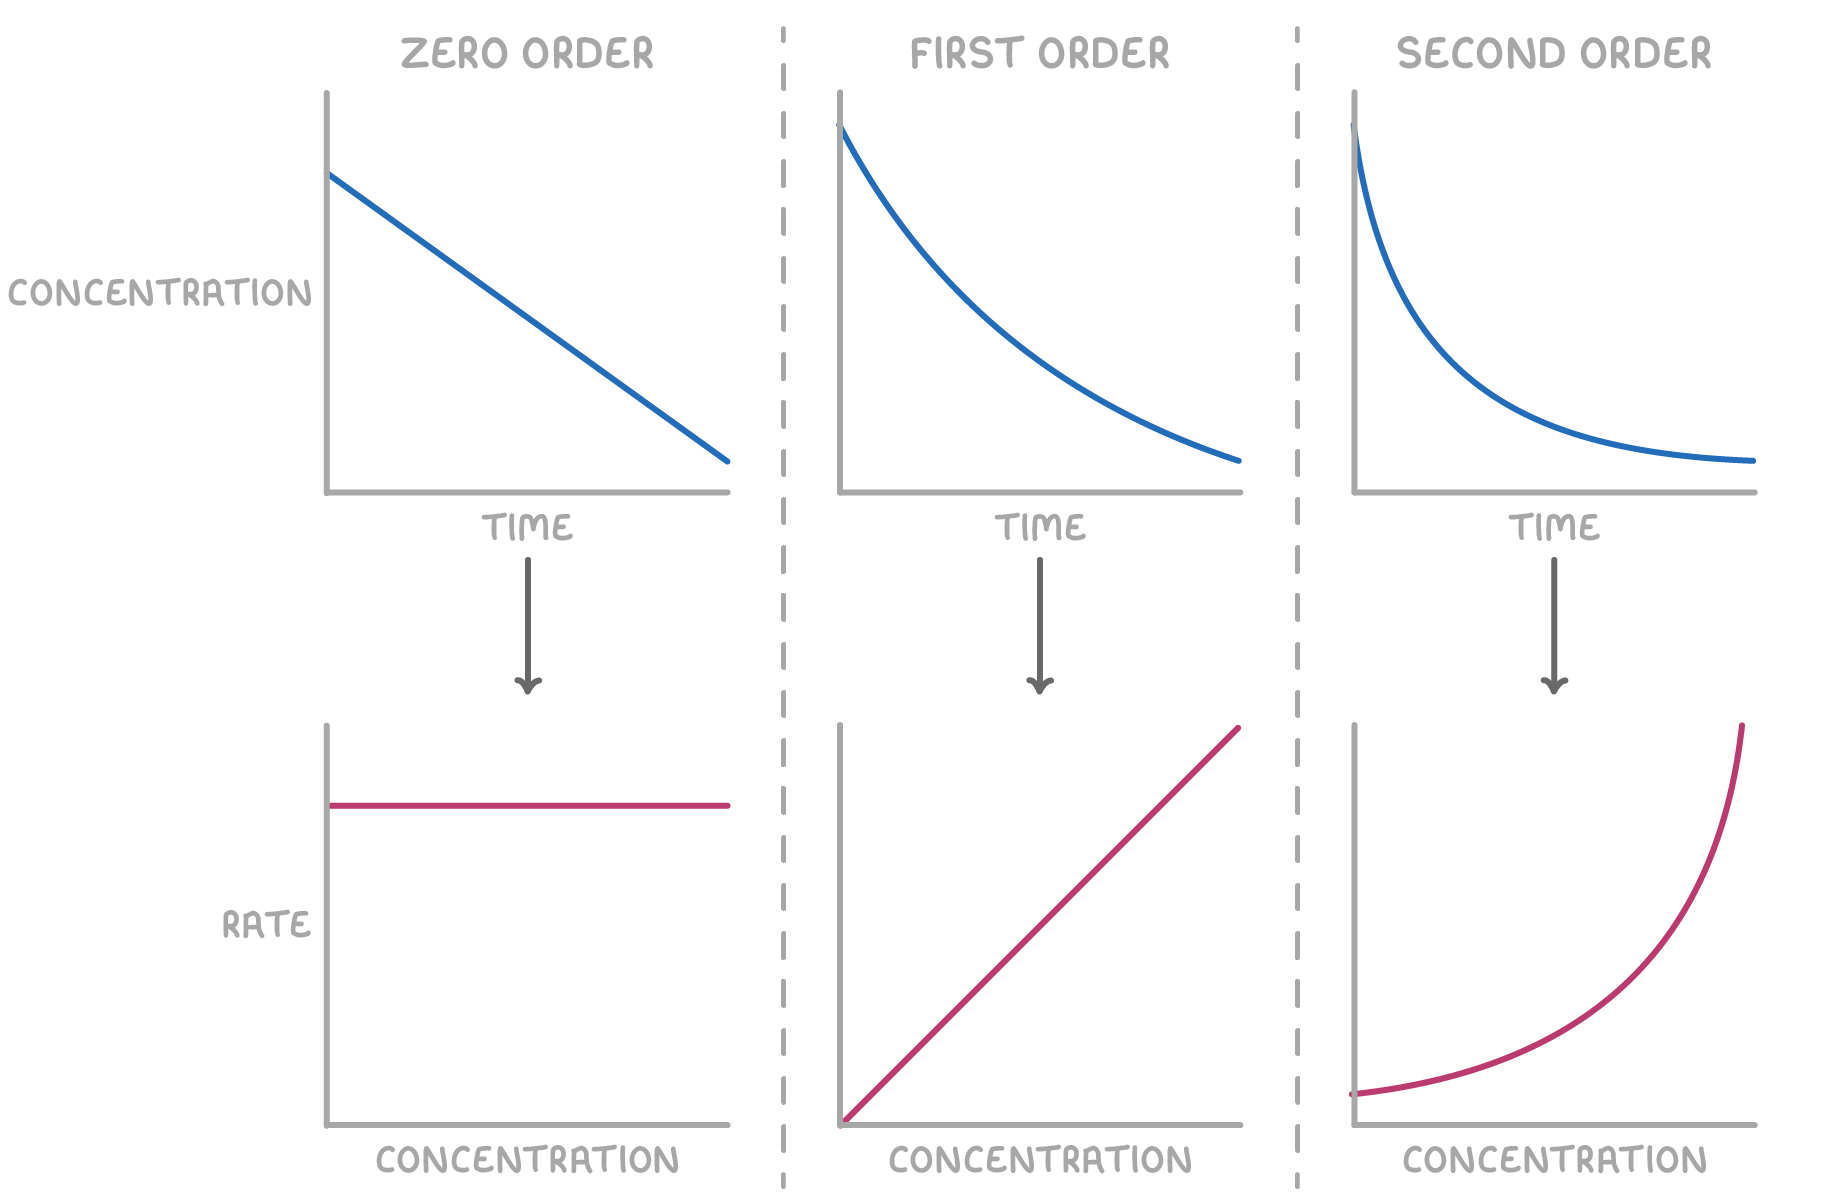
The shape of the resulting rate-concentration graph reveals the reaction order with respect to the reactant:
-
Zero order - A horizontal line indicates that the reaction rate is independent of the reactant concentration. The rate equation is: rate = k
-
First order - A straight line passing through the origin signifies that the reaction rate is directly proportional to the reactant concentration. The rate equation is: rate = k[X]
-
Second order - A curved plot indicates that the reaction rate is proportional to the square of the reactant concentration. The rate equation is: rate = k[X]2
In these equations, k represents the rate constant, and [X] denotes the concentration of reactant X.
First order reactions have constant half-lives
The half-life () of a reaction is the time taken for the concentration of a reactant to decrease to half of its initial value.
For first-order reactions:
- The half-life is independent of the initial concentration.
- Each successive half-life is the same duration.
- The half-life can be read directly from the concentration-time graph.
The rate constant (k) of a first-order reaction is related to its half-life () by the equation:
Worked example 1 - Calculating the rate constant from half-life data
The graph below illustrates the decomposition of hydrogen peroxide.
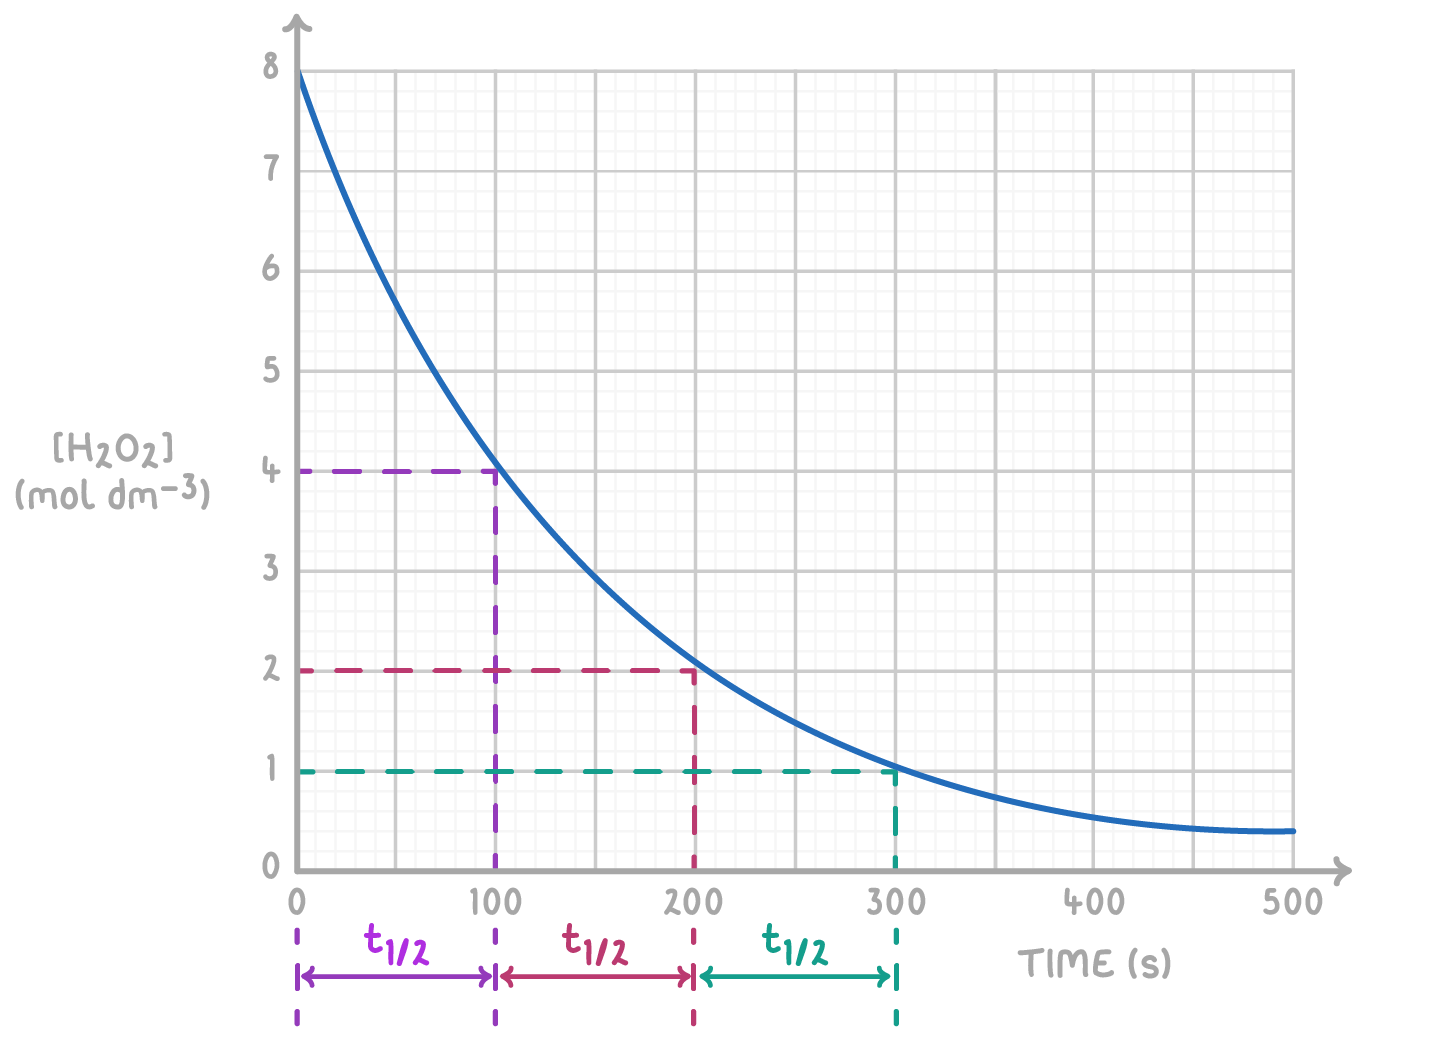
Determine the half-life at different concentration intervals and calculate the rate constant. Give your answer to 3 significant figures.
Step 1: Determine half-life
Half-life measurements:
- [H2O2] from 8 to 4 mol dm-3: = 100 s
- [H2O2] from 4 to 2 mol dm-3: = 100 s
- [H2O2] from 2 to 1 mol dm-3: = 100 s The consistent half-life of 100 s, regardless of concentration, confirms that the reaction is first-order with respect to H2O2.
Step 2: Equation
Step 3: Substitution and correct evaluation