1.2 - Comparing the Masses of Atoms - Mass Spectroscopy
- 1Interpreting mass spectra
- 2Calculating relative atomic mass and isotopic mass from mass spectra
- 3Predicting mass spectra of diatomic molecules
Interpreting mass spectra
A mass spectrum plots the relative abundance of ions against their mass-to-charge ratio (m/z).
-
The x-axis displays the m/z values. The m/z of each peak equals the relative mass of the ion.
-
The y-axis indicates the relative abundance of each ion, either in arbitrary units or as a percentage. For elemental samples, each peak represents a different isotope.
-
The relative height of each peak shows how abundant the isotope is.
-
Elements with only one stable isotope will show a single peak.
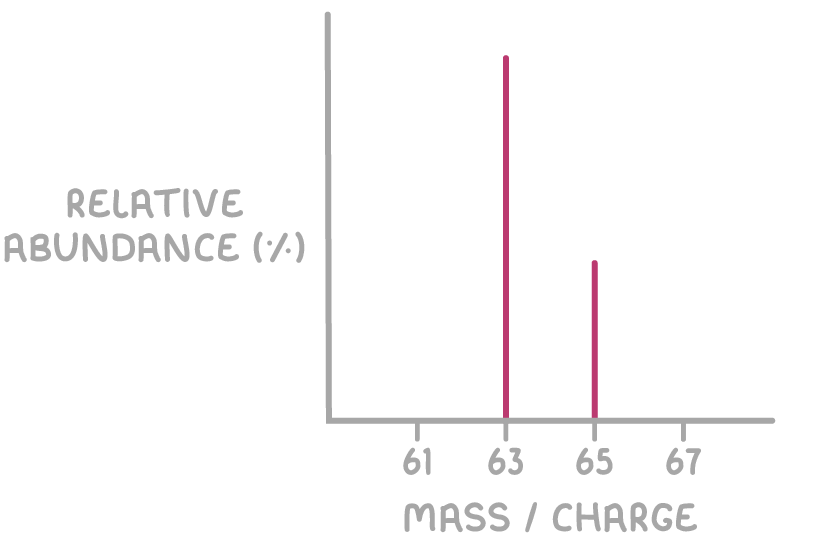
Below is the mass spectrum of an element with two stable isotopes.
For molecular samples, the peak at the highest m/z value is the molecular ion (M+).
- The m/z of the molecular ion peak matches the molecule's relative molecular mass (Mr).
- Peaks at lower m/z values come from fragments of the molecular ion. Below is the mass spectrum for a compound with a molecular mass of 72.
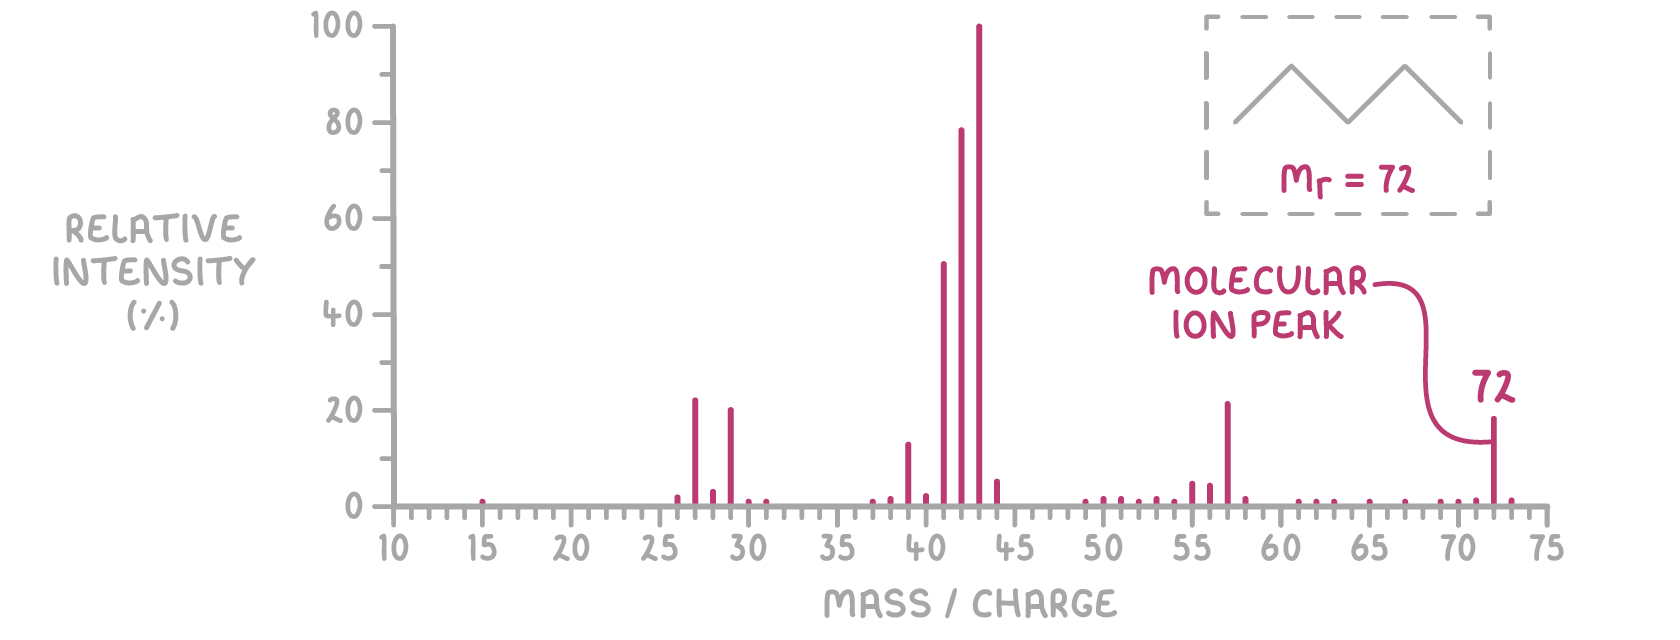
A smaller M+1 peak occurs at m/z = 73, representing molecular ions that contain the carbon-13 isotope.
Calculating relative atomic mass from mass spectra
To find an element's relative atomic mass (Ar) from its mass spectrum, follow these steps:
- Multiply the relative isotopic mass by its relative abundance for each isotope.
- Add these products together.
- Divide the total by the sum of the relative abundances (100 if using percentages).
Worked example 1 - Calculating the relative atomic mass of copper from its mass spectrum
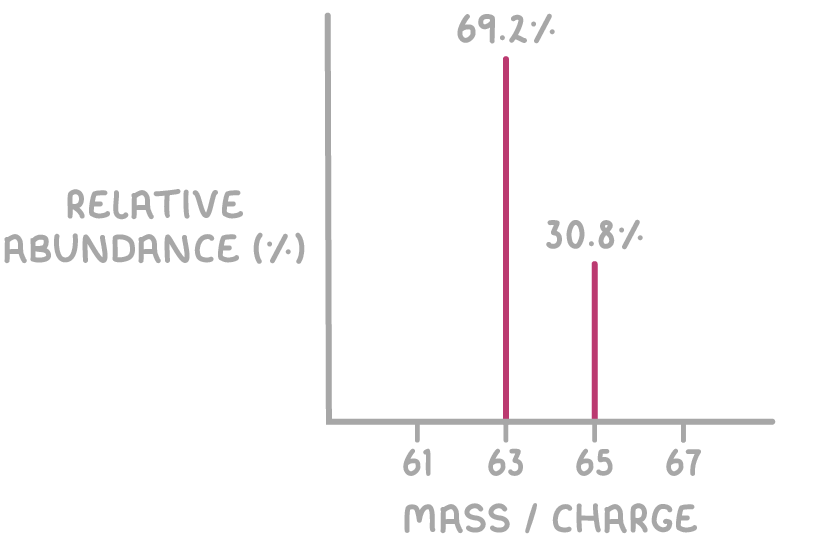
Calculate the relative atomic mass (Ar) of copper using the mass spectrum shown below:
Step 1: Multiply the relative isotopic mass by its relative abundance for each isotope
For 63Cu: 63 x 69.2 = 4,359.6
For 65Cu: 65 x 30.8 = 2,002.0
Step 2: Sum these values
Sum = 4,359.6 + 2,002.0 = 6,361.6
Step 3: Divide by the total relative abundance
Total relative abundance = 69.2 + 30.8 = 100.0
16
Therefore, the calculated relative atomic mass (Ar) of copper from its mass spectrum is 63.6.
Worked example 2 - Calculating isotopic mass from relative atomic mass
Magnesium can exist in three isotopes. 78.99% of magnesium is 24Mg and 10.00% of magnesium is 25Mg. Given that the Ar of magnesium is 24.31, calculate the abundance and isotopic mass of the third isotope.
Step 1: Calculate the abundance of the third isotope
Abundance of the third isotope =
Step 2: Use the relative atomic mass formula to find the isotopic mass
Relative atomic mass formula =
Step 3: Rearrange to solve for X:
1,895.76 + 250 + 11.01x = 2,431
So, the isotopic mass of the third isotope is approximately 26 (rounded to the nearest whole number).
Worked example 3 - Predicting the mass spectra for diatomic molecules
Chlorine has two isotopes. 35Cl has an abundance of 75% and 37Cl has an abundance of 25%. Predict the mass spectrum of Cl2.
Step 1: Express each percentage as a decimal
75% = 0.75 and 25% = 0.25
Step 2: Create a table showing all different Cl2 molecules
| Isotope | Calculation |
|---|---|
| ^35^Cl-^35^Cl | 0.75 × 0.75 = 0.5625 |
| ^35^Cl-^37^Cl | 0.75 × 0.25 = 0.1875 |
| ^37^Cl-^35^Cl | 0.25 × 0.75 = 0.1875 |
| ^37^Cl-^37^Cl | 0.25 × 0.25 = 0.0625 |
Step 3: Combine abundances for identical molecules
For 35Cl37Cl and 37Cl35Cl: 0.1875 + 0.1875 = 0.375
Step 4: Calculate relative abundances and molecular masses
| Molecule | Relative abundance | Molecular mass |
|---|---|---|
| ^35^Cl-^35^Cl | 35 + 35 = 70 | |
| ^35^Cl-^37^Cl | 35 + 37 = 72 | |
| ^37^Cl-^37^Cl | 37 + 37 = 74 |
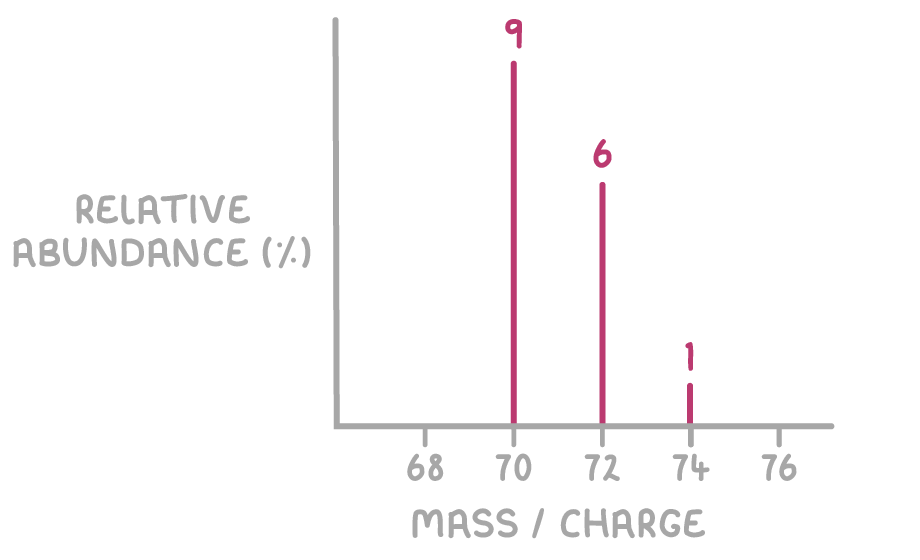
The predicted mass spectrum for Cl2 will have peaks at m/z 70, 72, and 74 with relative abundances 9, 6, and 1, respectively, as shown below.