Atomic Structure - exam practice
Atomic Structure
Question 1 of 11
An atom of nitrogen can form a nitride ion with an electronic configuration of 1s22s22p6.
State the formula of the nitride ion.
An element forms an ion, W, with a single negative charge that has the same electron configuration as the nitride ion.
State the formula of W.
An element forms an ion, R, with a single positive charge that has a full 3p sub-shell as its highest energy level.
State the formula of R.
Define the term isotope.
Define the term relative atomic mass.
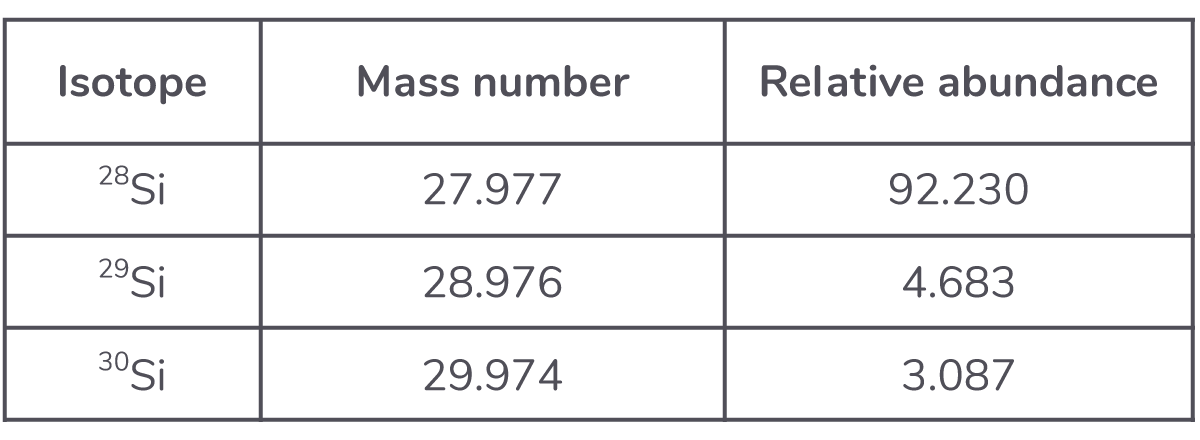
Calculate the relative atomic mass of silicon using information in the table below.
Give your answer to two decimal places.
This question is about the isotopes of krypton.
A sample of krypton containing the isotopes 82Kr, 83Kr, 84Kr and 86Kr has a relative atomic mass of 83.8.
The sample contains 11.6% each of the 82Kr and 83Kr isotopes.
Calculate the percentage abundance of each of the other two isotopes.
Give your answers to one decimal place.
This question is about atomic structure.
Define the mass number of an atom.
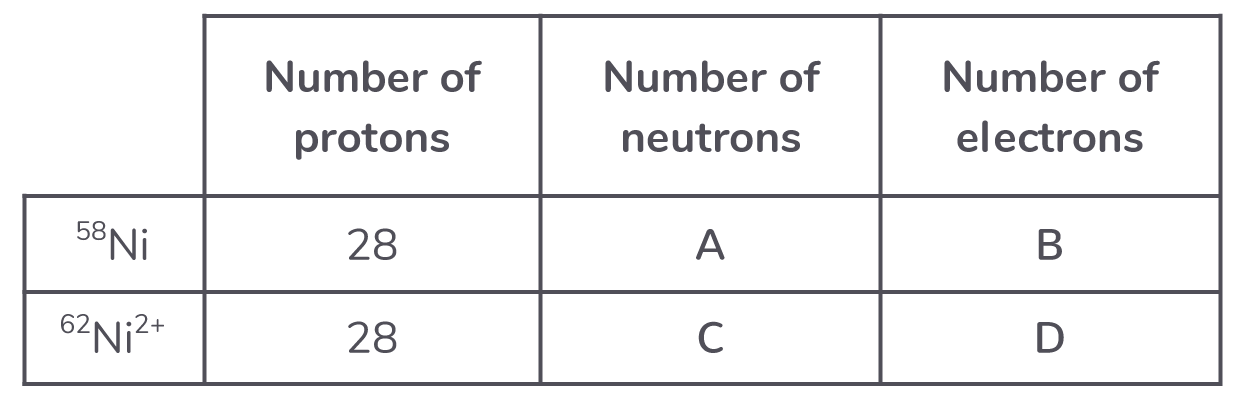
The table below gives some isotopic information about an atom and an ion of nickel.
Identify the missing values A-D.
A sample of nickel contains three isotopes, 58Ni, 60Ni and 62Ni.
This sample has a relative atomic mass of 58.7
In this sample the ratio of abundance of isotopes 60Ni and 62Ni is 7:1
Calculate the percentage abundance of 58Ni in this sample.
Give your answer to one decimal place.
A sample of iron, which consists of three isotopes, has a relative atomic mass of 55.909. The isotopic information for two of the isotopes is shown in the table below. The data for one of the isotopes, mFe, is missing.

Use this data to calculate m, the mass number of mFe.
Time of flight mass spectrometry is used to analyse a sample of tin.
The sample is ionised by electron impact to form 1+ ions.
The mass spectrum of this sample of tin has four peaks.
Data from the spectrum is shown in the table below.
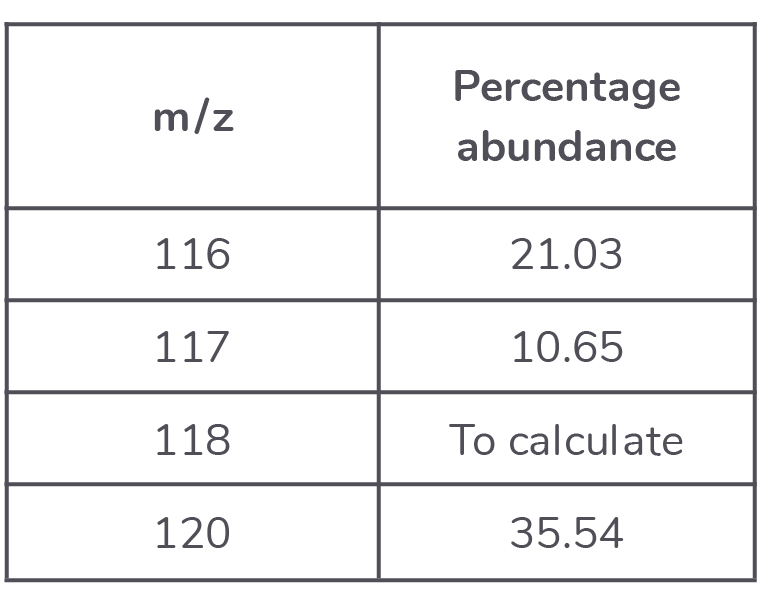
Calculate the relative atomic mass of tin in this sample.
Give your answer to one decimal place.
State the number of electrons that can fill the first 4 energy levels.
First energy level = electrons
Second energy level = electrons
Third energy level = electrons
Fourth energy level = electrons
Give the full electronic configuration of an atom of sulfur.
Give the full electronic configuration of a manganese atom.
This question is about isotopes.
Most elements contain atoms of different isotopes.
State one similarity and one difference between the atomic structures of isotopes of the same element.
Mass spectrometry can be used to identify the isotopes of chlorine.
Part of the mass spectrum of chlorine is shown below.
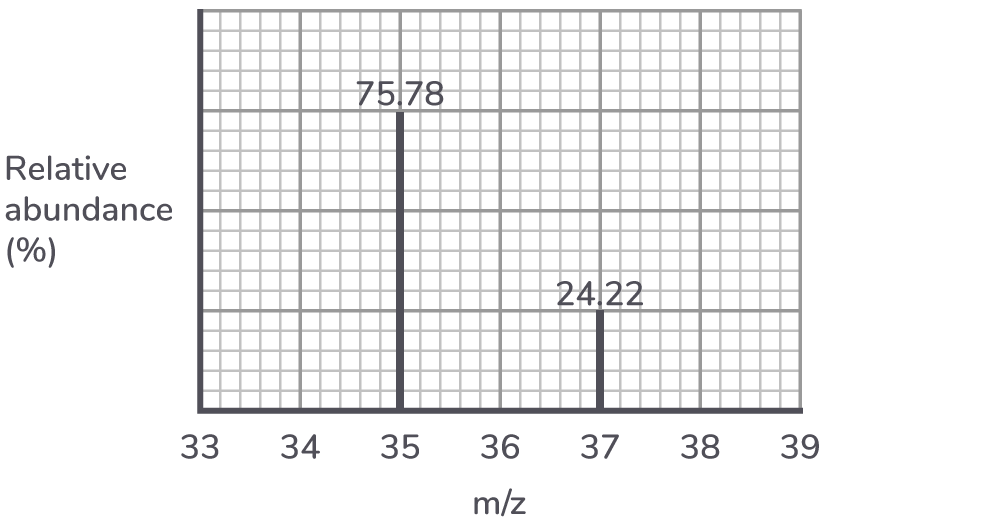
Calculate the relative atomic mass of chlorine.
Give your answer to two decimal places.
Three molecular ion peaks, M+, are found in the mass spectrum of chlorine, Cl2.
The three M+ peaks have m/z values of 70, 72 and 74 respectively.
Suggest why each M+ peak is observed.
Elements are arranged into blocks in the Periodic Table based on their electron configuration.
We now know that electrons are in shells; shells have sub-shells and sub-shells have orbitals.
Define the term orbital.
State the maximum number of electrons which can fill each region of an atom:
The 2s orbital: electrons
The 2p orbital: electrons
The 3d sub-shell: electrons
The third energy level: electrons
Write the full electronic configuration of an atom of copper.
An atom has 2 more protons and 5 more neutrons than an atom of 65Zn.
Write the symbol, including the mass number, for this atom:
Draw the shape of an s orbital and the shape of a p orbital.
Outline the model of electron configuration deduced from the hydrogen line emission spectrum (Bohr model).
The first four energy levels of the hydrogen atom are represented in the energy level diagram below.
Draw the lines that represent the electron transitions to n=2 in the emission spectrum.
Describe the emission spectrum of hydrogen.
Outline how this spectrum is related to the energy levels in the the hydrogen atom.
Draw the first four energy levels of a hydrogen atom on the axis, labelling n = 1, 2, 3 and 4. On your diagram, include the lines that represent them.
Explain the convergence of lines in a hydrogen emission spectrum.
The mass spectrum of a sample of selenium is shown below.
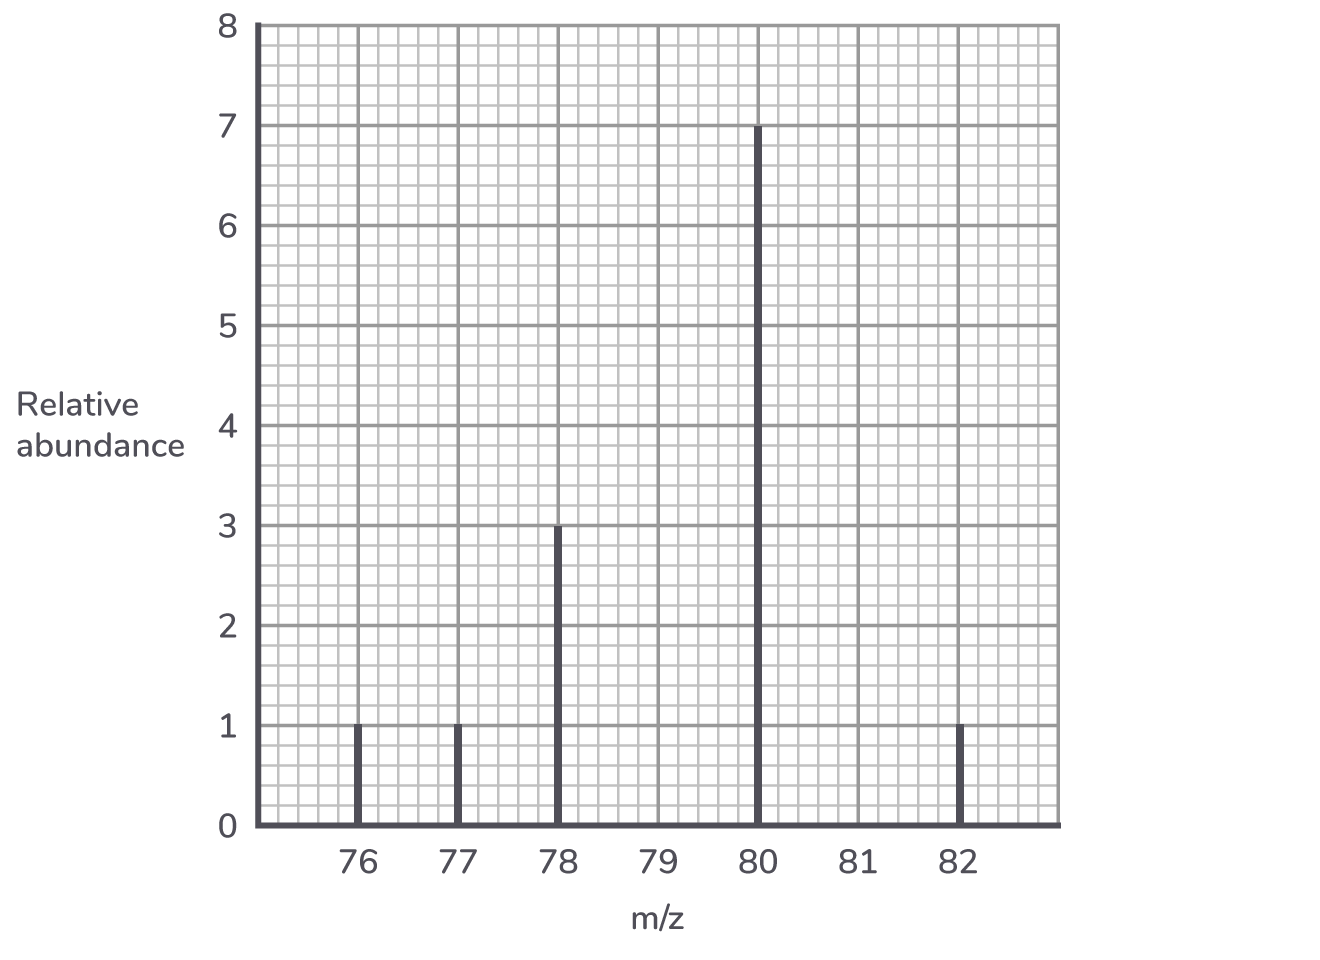
Use this spectrum to calculate the relative atomic mass of this sample of selenium.
Give your answer to one decimal place.
Explain why the Ar value of selenium you have calculated differs slightly from the relative atomic mass given in the Periodic Table.
The mass spectrum of a diatomic molecule, Y2, has peaks at the following m/z values for the Y2+ ion:
32, 33, 34, 35, 36
Deduce the formula of all the species responsible for each of the peaks in the mass spectrum of Y2, identifying element Y and showing clearly the isotopes present.