37.3 - Proton Nuclear Magnetic Resonance
- 1How NMR spectroscopy provides structural information
- 2The use of tetramethylsilane (TMS) as a reference standard
- 3What 1H NMR spectroscopy tells us
- 4Chemical shifts and functional group identification
- 5Peak splitting patterns and the n+1 rule
- 6The role of deuterated solvents in 1H NMR
Chemical environments influence magnetic properties
In NMR spectroscopy, when a molecule is placed in an external magnetic field, the nuclei within the molecule experience varying degrees of shielding from the external magnetic field. This shielding is due to their local "chemical environment" which encompasses all atoms, functional groups, and bonds directly connected to the nucleus.
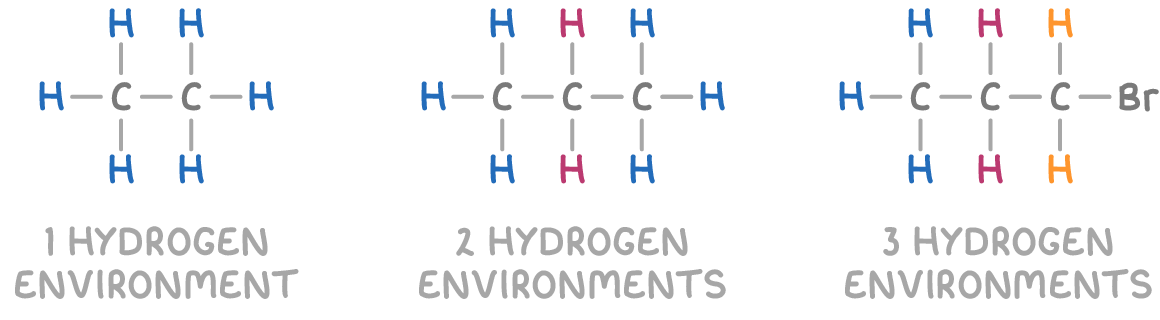
The electron density surrounding each nucleus acts as a magnetic shield, protecting it from the full strength of the external magnetic field. The degree of shielding varies depending on the specific chemical environment, with nuclei in different environments experiencing slightly different resonance frequencies when absorbing radio waves.
The more shielded a nucleus is, the lower its resonance frequency will be, as it requires less energy to flip its spin state in the presence of an external magnetic field.
By analysing these variations in resonance frequencies various nuclear environments, NMR spectroscopy provides valuable information about molecular structure.
Chemical shift
In NMR spectroscopy, chemical shift (δ) is a measure of the difference in resonant frequency between a given nucleus and a reference standard. It is expressed in parts per million (ppm) and it increases from right to left on the x-axis of an NMR spectrum.
Tetramethylsilane (Si(CH3)4), or TMS, is used as the standard in NMR spectroscopy because:
- TMS produces a single absorption peak due to all its hydrogen atoms being in identical chemical environments.
- The TMS peak appears at a lower frequency, located to the right of most analytes on the NMR spectrum, making it an ideal reference point.
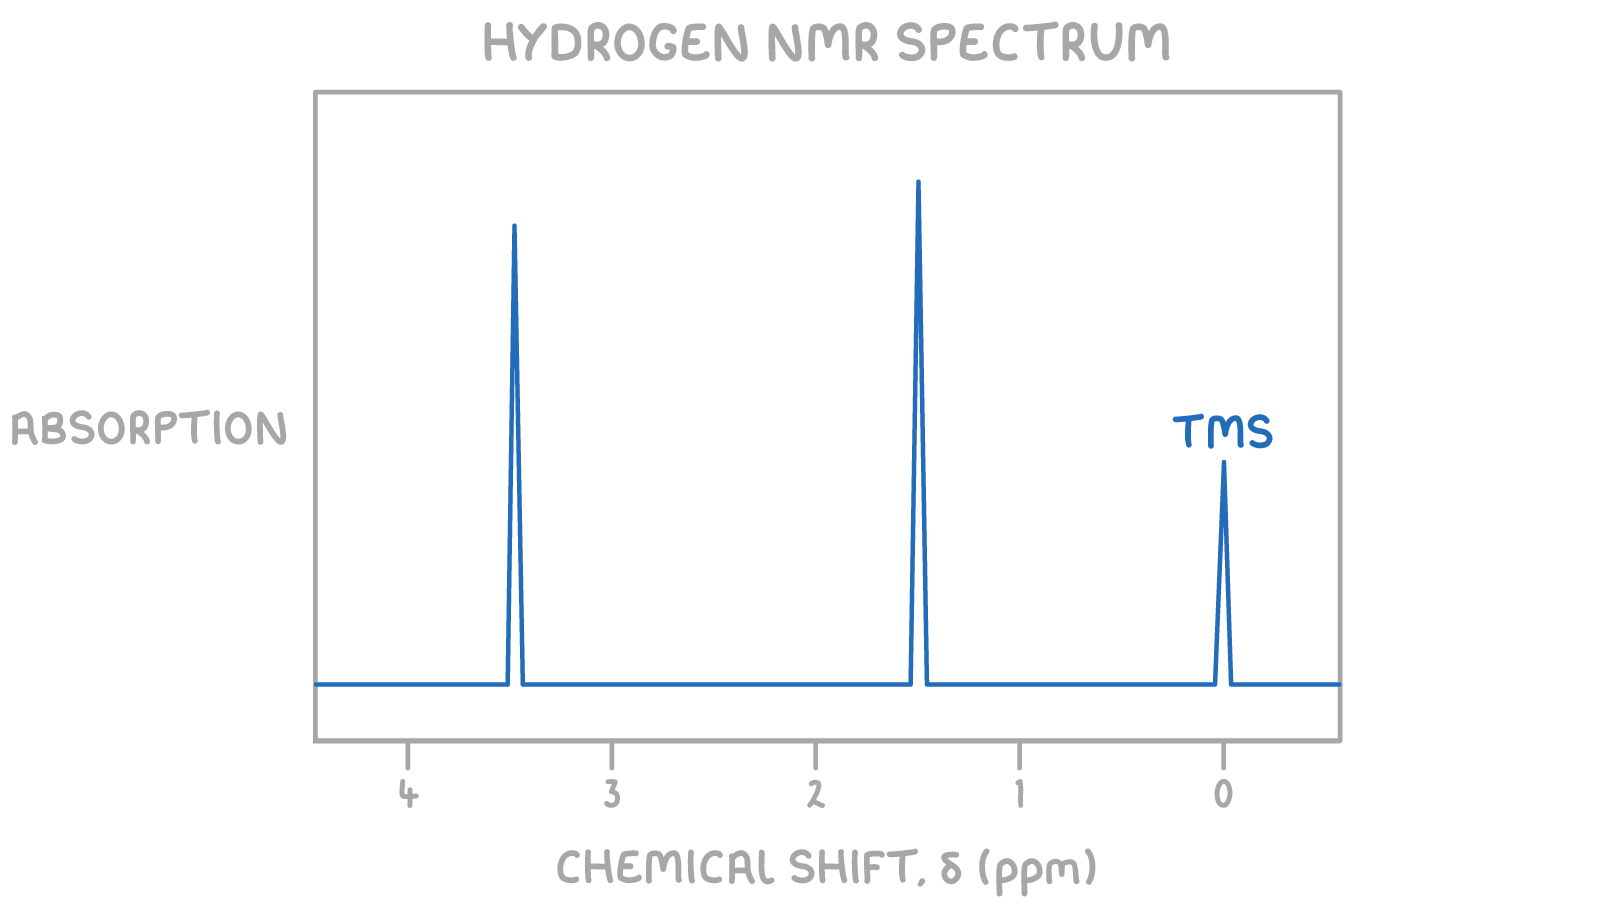
The TMS peak is assigned a chemical shift value of 0 ppm, serving as the reference point for measuring chemical shifts of other peaks in the spectrum.
Peaks from the sample that absorb at frequencies higher than that of TMS appear at higher chemical shift values measured relative to the TMS peak at 0 ppm. These peaks are located to the left of the TMS peak, indicating that the corresponding nuclei are less shielded than TMS. Consequently, these nuclei experience a stronger effective magnetic field.
1H NMR determines hydrogen environments
Proton nuclear magnetic resonance (1H NMR) spectroscopy is a technique that provides detailed information about the different environments of hydrogen atoms within an organic molecule.
In a 1H NMR spectrum:
- Each peak represents a set of chemically equivalent hydrogen atoms, which is referred to as a hydrogen environment.
- The peak area is proportional to the number of hydrogen atoms in that environment.
- The position of the peak on the chemical shift scale helps identify the type of hydrogen atom present.
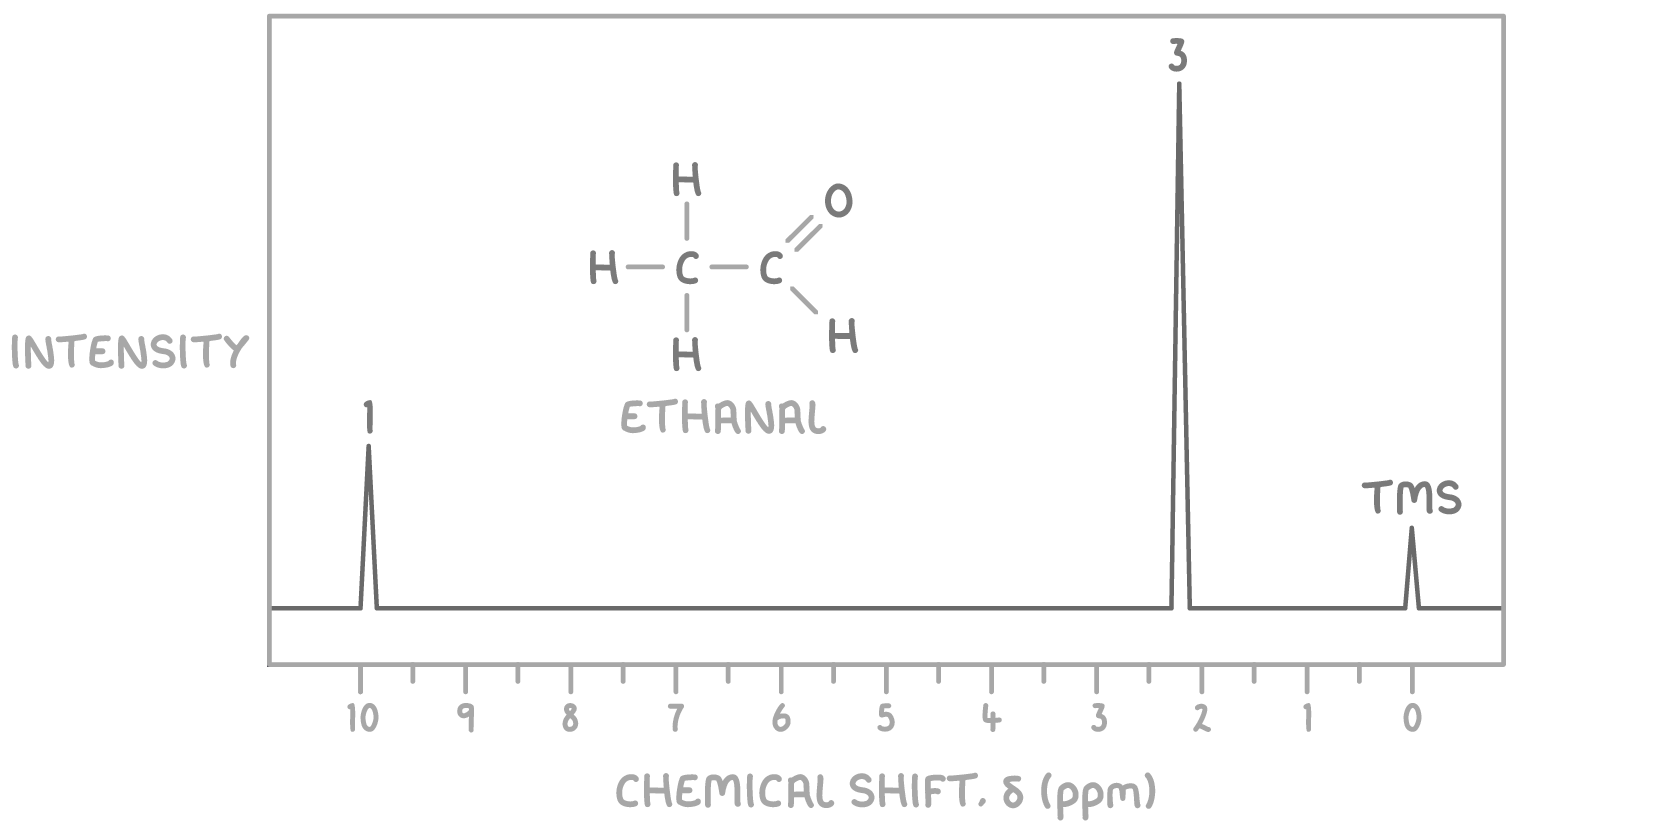
For example, the 1H NMR spectrum of ethanal, shown above, displays:
- 2 peaks, indicating two different environments for the protons.
- Peak areas in a 3:1 ratio, corresponding to the number of protons in each environment.
Chemical shift ranges help assign peaks
The chemical shift (δ) value of each peak specifies its exact position.
This value, measured in parts per million (ppm), can help identify the hydrogen environment:
| Chemical Shift δ (ppm) | Type of H atom |
|---|---|
| 0.5 – 5.0 | ROH (alcohol) |
| 0.7 – 1.2 | RCH3 |
| 1.0 – 4.5 | RNH2 (amine) |
| 1.2 – 1.4 | R2CH2 |
| 1.4 – 1.6 | R3CH |
| 2.1 – 2.6 | R-(C=O)-CH (ketone) |
| 3.1 – 3.9 | R-O-CH |
| 3.1 – 4.2 | RCH2Br or RCH2Cl |
| 3.7 – 4.1 | R-(C=O)-O-CH (ester) |
| 4.5 – 6.0 | R-C=CH (alkene) |
| 9.0 – 10.0 | R-(C=O)-H (aldehyde) |
| 10.0 – 12.0 | R-(C=O)-OH (carboxylic acid) |
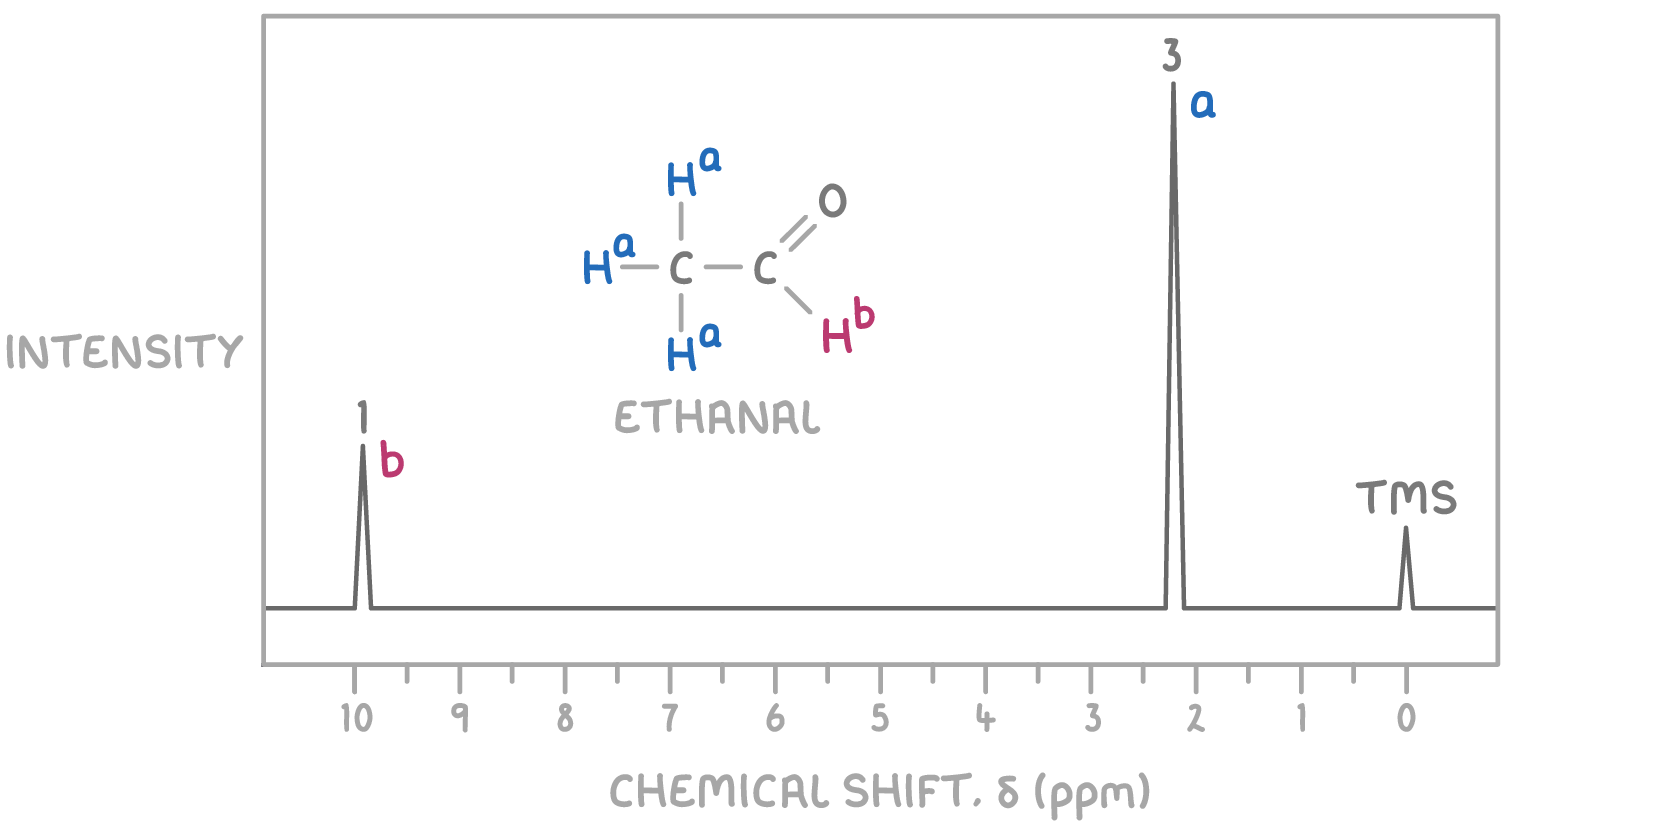
For example, in the 1H NMR spectrum of ethanal shown above:
- The peak at δ 2.2 ppm is indicative of CH3-, aligning with CH3CHO.
- The peak at δ 9.8 ppm corresponds to -CHO, further confirming CH3CHO.
Spin-spin coupling
Spin-spin coupling among adjacent hydrogen atoms results in the splitting of NMR peaks into sub-peaks. This effect occurs only between hydrogens on neighbouring carbons. Spin-spin coupling patterns reveal the number of non-equivalent protons on adjacent carbon atoms.
The formula for determining the number of peaks in a split signal is the n+1 rule:
For a proton with n protons attached to an adjacent carbon atom, the number of sub-peaks in a splitting pattern = n + 1
This rule adds another layer of structural detail:
| Number of neighbouring hydrogens | Number of sub-peaks | Splitting pattern | Peak ratio |
|---|---|---|---|
| 0 | 1 | singlet | 1 |
| 1 | 2 | doublet | 1:1 |
| 2 | 3 | triplet | 1:2:1 |
| 3 | 4 | quartet | 1:3:3:1 |
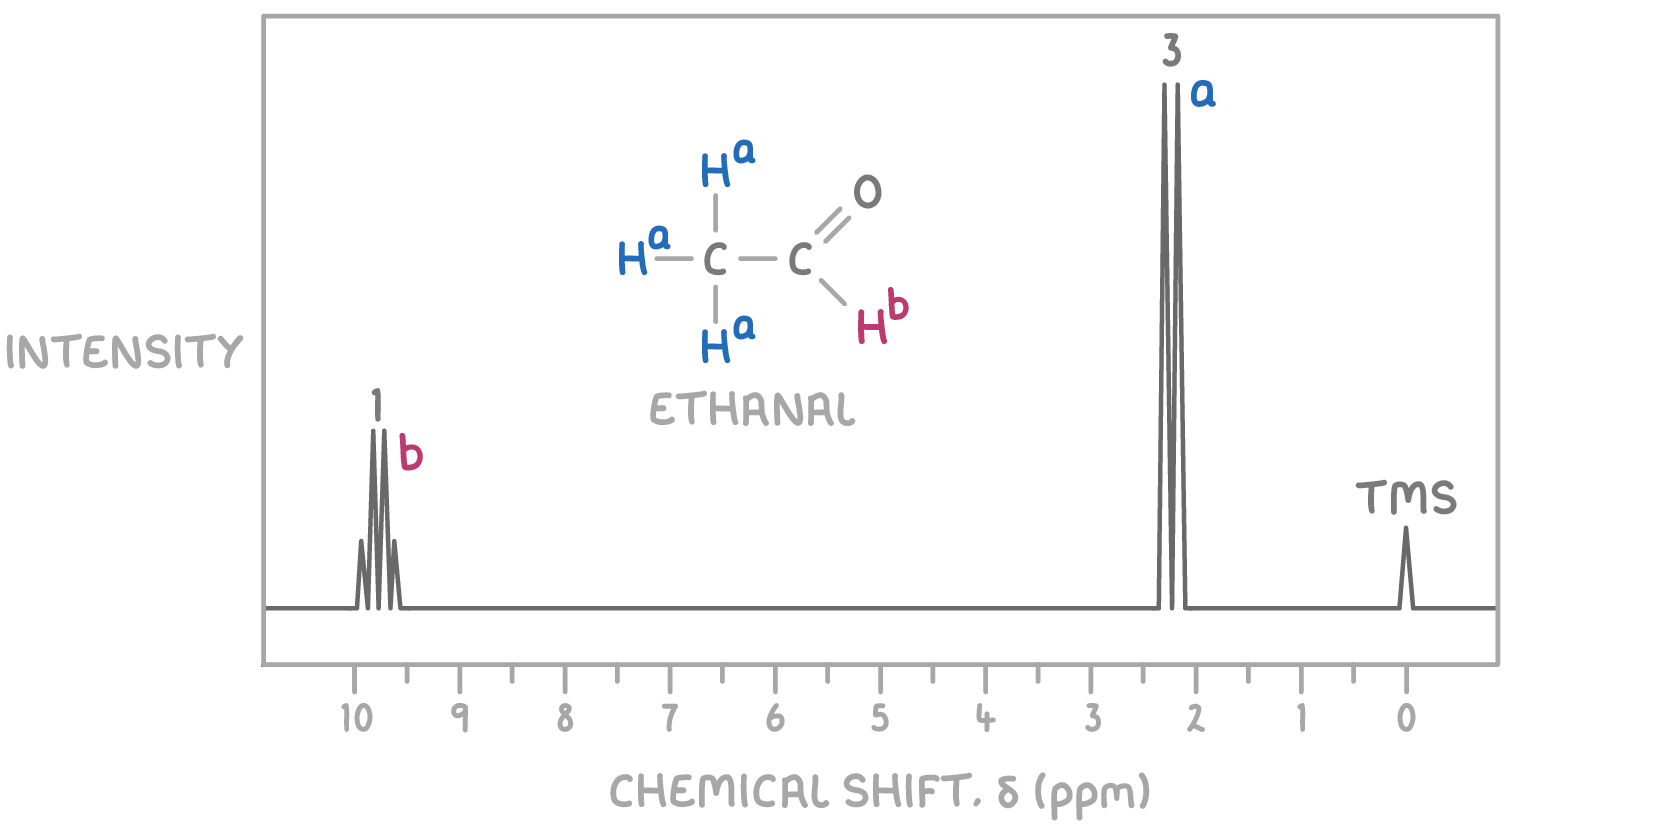
For example, in the 1H NMR spectrum of ethanal shown above:
- The peak at δ 2.2 ppm due to Ha is a doublet because there's one hydrogen on the adjacent carbon atom.
- The peak at δ 9.8 ppm due to Hb is a quartet because there are three hydrogens on the adjacent carbon atom.
Deuterated solvents are used in 1H NMR
To perform 1H NMR, the sample must be dissolved in a solvent. However, protons in common solvents like H2O would contribute unwanted peaks to the spectrum.
To overcome this issue, deuterated solvents are used. These solvents have their hydrogen atoms replaced with deuterium (2H), which produces signals outside the range observed in 1H NMR, ensuring only the sample's peaks are observed.
Common deuterated solvents include deuterium oxide (D2O) and deuterated chloroform (CDCl3).
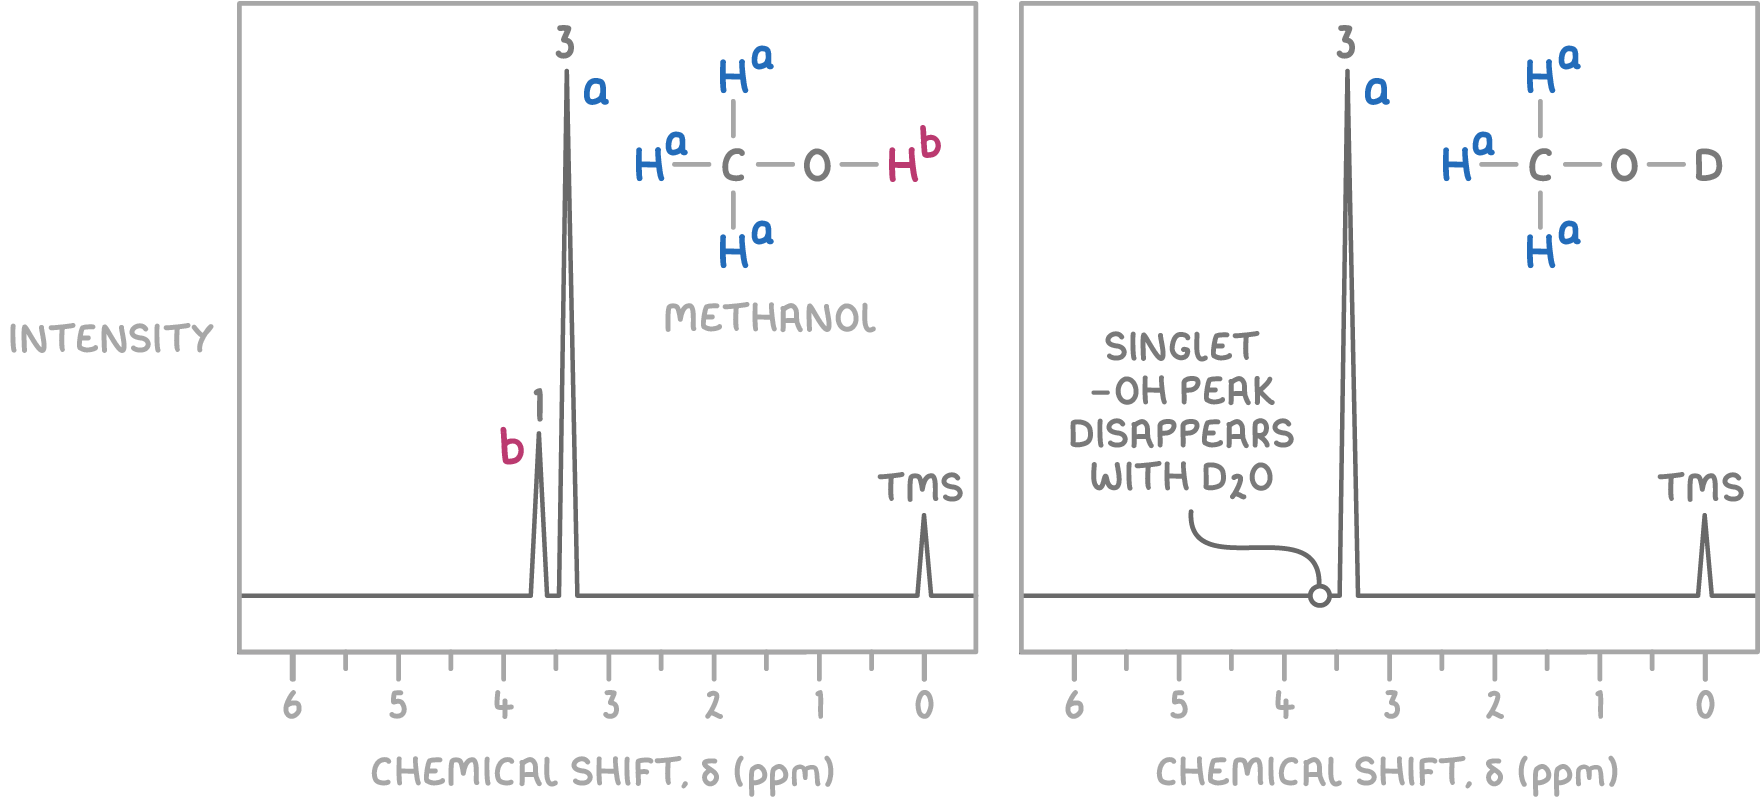
Confirming the identity of -OH and -NH protons using D2O
Protons bonded to oxygen (-OH) or nitrogen (-NH) give broad, variable peaks in a proton NMR spectrum due to hydrogen bonding.
To verify if a peak comes from an -OH or -NH proton:
- Acquire two NMR spectra of the sample - one without D2O added and one with D2O added.
- If the -OH/-NH peak is present in the first spectrum but disappears in the second spectrum, it means proton exchange has occurred between the O-H/N-H and D2O. The disappearance of the peak specifically upon D2O addition confirms that peak was due to an -OH or -NH proton.
For example, the following equilibrium is set up with methanol:
CH3OH + D2O ⇌ CH3OD + HOD
Worked example 1 - Identifying the structure of an unknown molecule
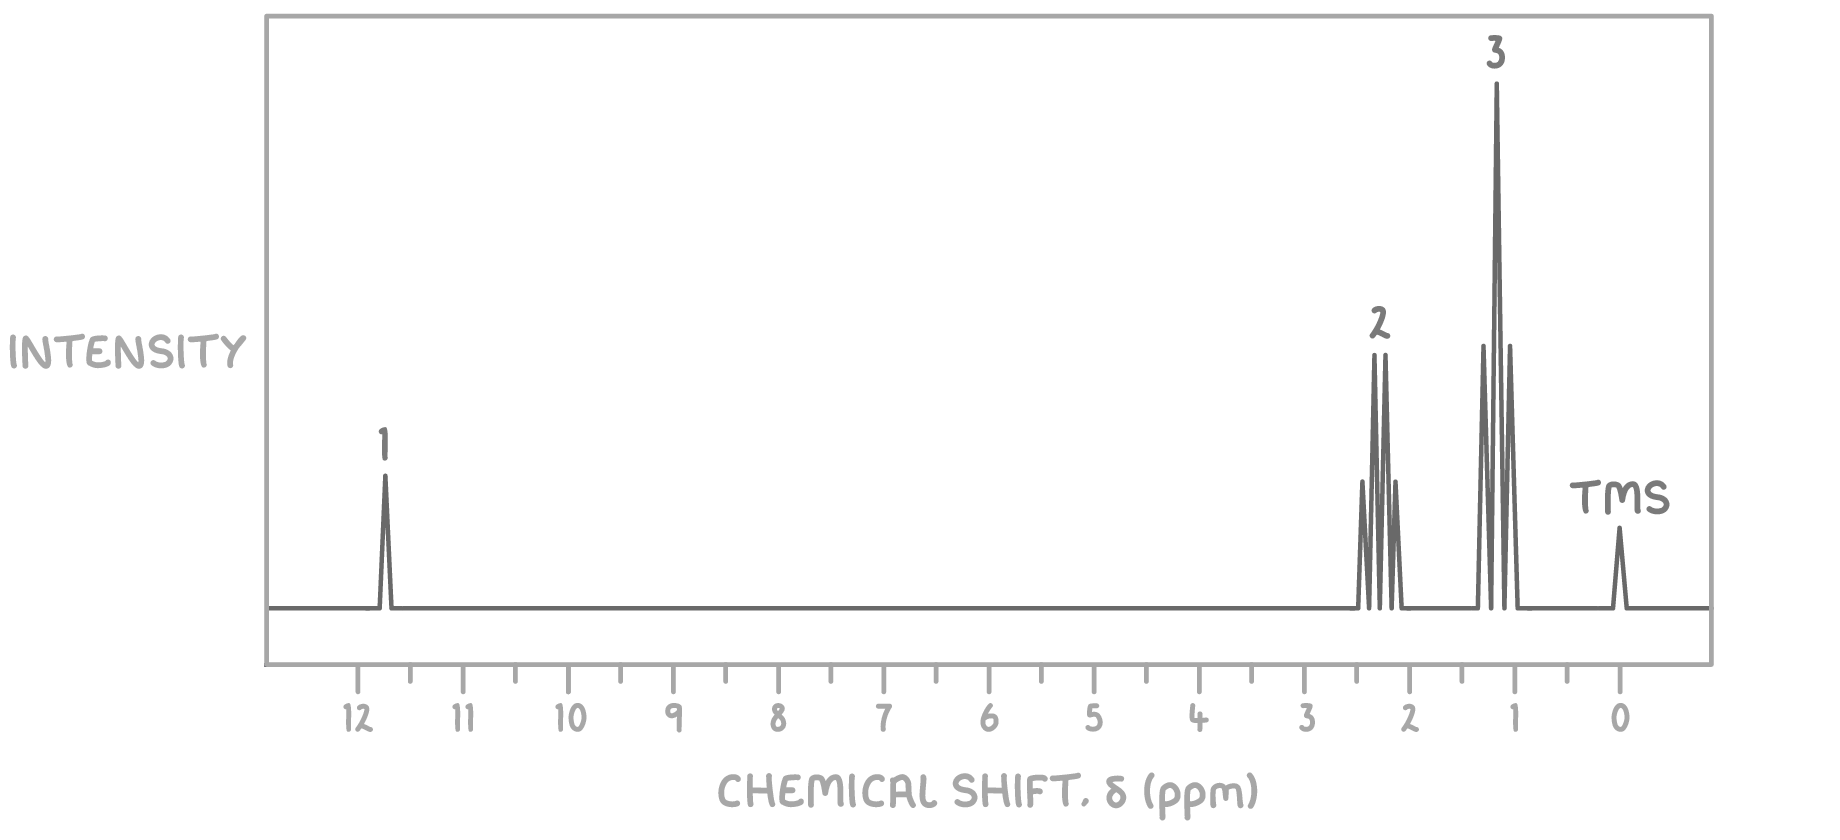
Using the molecular formula C3H6O and the 1H NMR spectrum provided below, determine the structure of the unknown molecule.
Step 1: Count signals
The presence of three distinct signals indicates three sets of magnetically non-equivalent hydrogen atoms in the molecule.
Step 2: Deduce environments from chemical shifts
- The triplet at δ 1.2 ppm suggests a methyl group (CH3) adjacent to a CH2 group.
- The quartet at δ 2.4 ppm suggests a CH2 group adjacent to a methyl group.
- The singlet at δ 11.7 ppm is characteristic of the acidic hydrogen (H) of a carboxylic acid.
Step 3: Consider the molecular formula
Given the molecular formula C3H6O2 and the signal patterns observed, the compound likely contains a carboxylic acid functional group, as indicated by the very downfield singlet at δ 11.7 ppm.
Step 4: Match environments to potential structures
Considering the NMR signal characteristics:
- The methyl group (CH3) giving rise to the triplet at δ 1.2 ppm suggests it is next to a CH2 group, which in turn shows as a quartet at δ 2.4 ppm due to splitting by the three hydrogen atoms of the methyl group.
- The singlet at δ 11.7 ppm clearly indicates the presence of the acidic hydrogen of the carboxylic acid group.
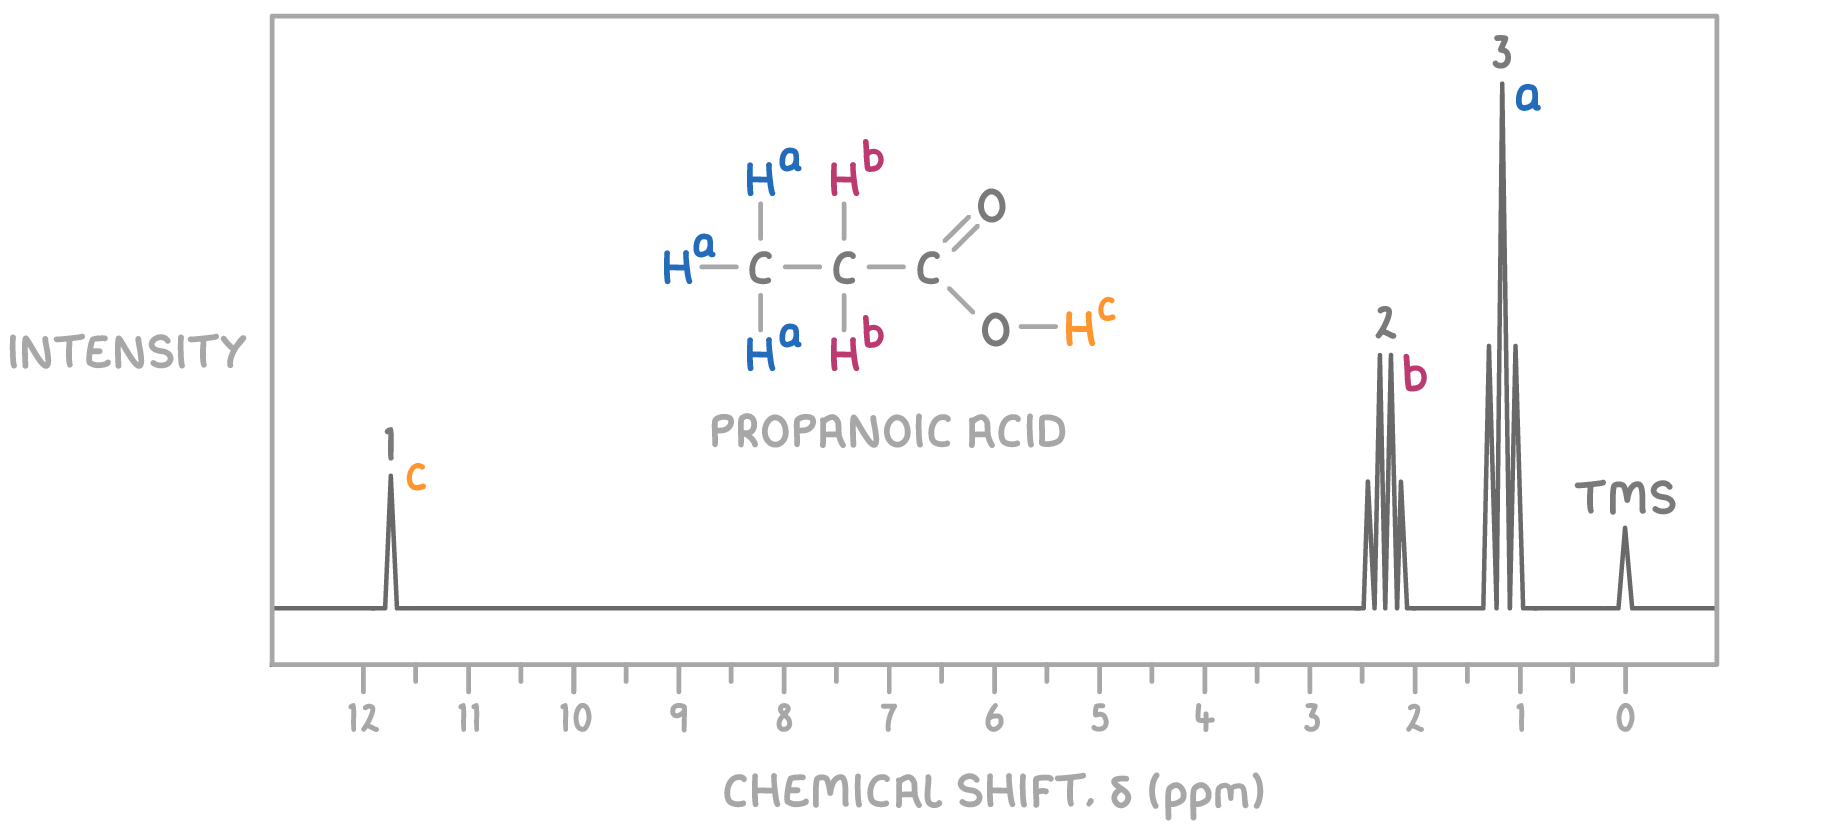
The structure that fits these criteria is propanoic acid, where the methyl group is responsible for the signal at δ 1.2 ppm, the CH2 group adjacent to the carboxylic acid gives rise to the signal at δ 2.4 ppm, and the carboxylic acid proton is responsible for the singlet at δ 11.7 ppm.
Therefore, the unknown molecule is identified as propanoic acid.
Worked example 2 - Identifying the structure of an unknown molecule
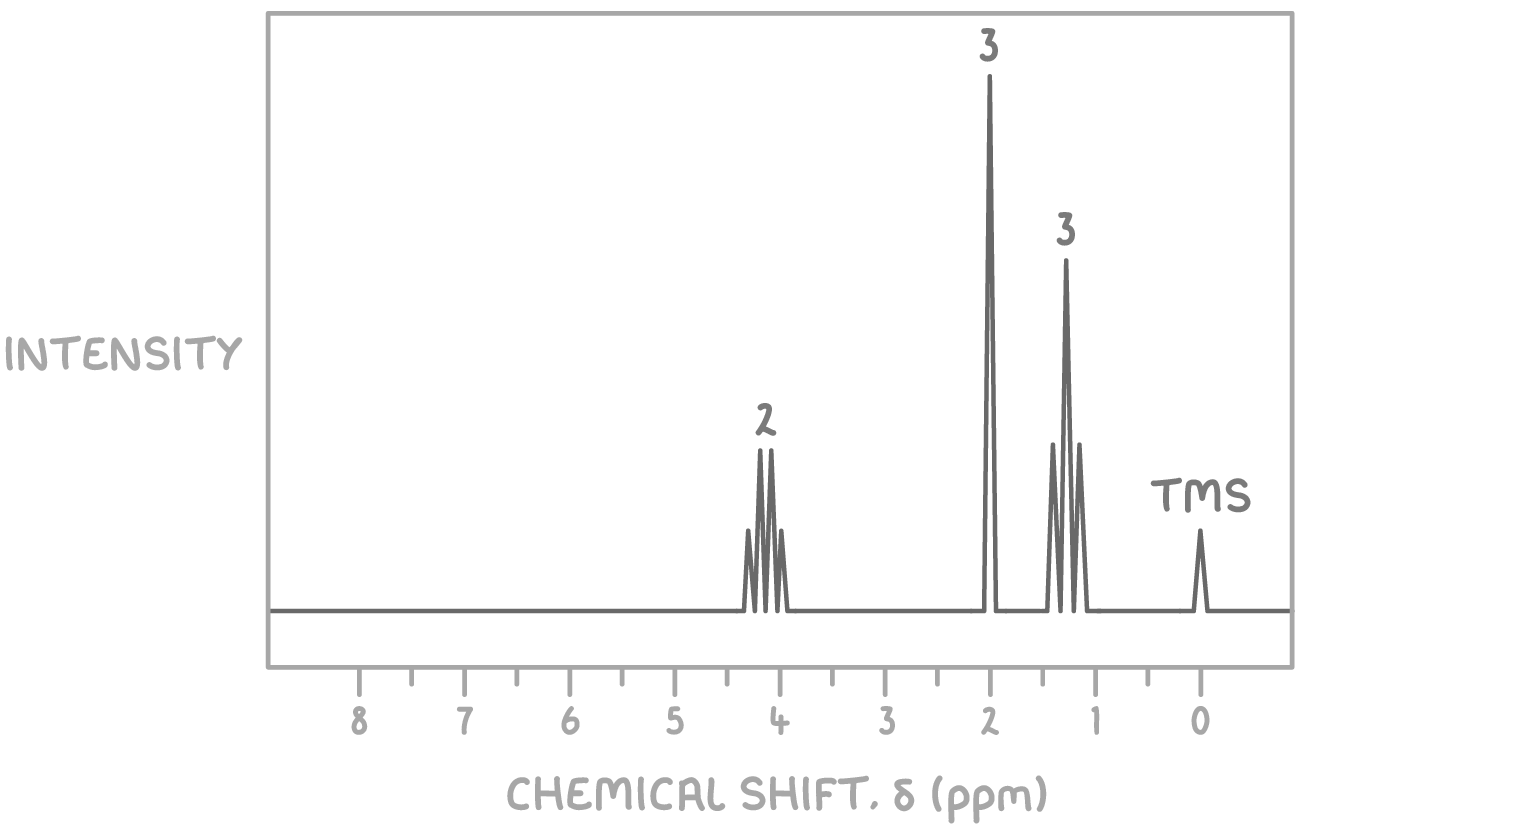
Using the molecular formula C4H8O2 and the 1H NMR spectrum provided below, determine the structure of the unknown molecule.
Step 1: Count signals
The presence of three distinct signals indicates three sets of magnetically non-equivalent hydrogen atoms in the molecule.
Step 2: Deduce environments from chemical shifts
- The triplet at δ 1.3 ppm suggests a methyl group (CH3) adjacent to a CH2 group.
- The singlet at δ 2.0 ppm is characteristic of hydrogen atom(s) on a carbon without neighbouring hydrogen atoms, commonly associated with the carbonyl group in esters or ketones.
- The quartet at δ 4.1 ppm is characteristic of a CH2 group adjacent to a methyl group, often observed in esters linked directly to oxygen.
Step 3: Consider the molecular formula
Given the molecular formula C4H8O2 and the signal patterns observed, the compound likely contains a functional group that accounts for the oxygen atoms, such as an ester, given the absence of NMR signals typical for hydroxyl (OH) or carboxylic acid (COOH) protons.
Step 4: Match environments to potential structures
Considering the NMR signal characteristics:
- The methyl group (CH3) giving rise to the triplet at δ 1.3 ppm suggests it is next to a CH2 group, which in turn shows as a quartet at δ 4.1 ppm due to splitting by the three hydrogen atoms of the methyl group. This CH2 group is likely attached to an oxygen atom, as indicated by its chemical shift.
- The singlet at δ 2.0 ppm can be attributed to the CH3 group attached to the carbonyl carbon, characteristic of esters.
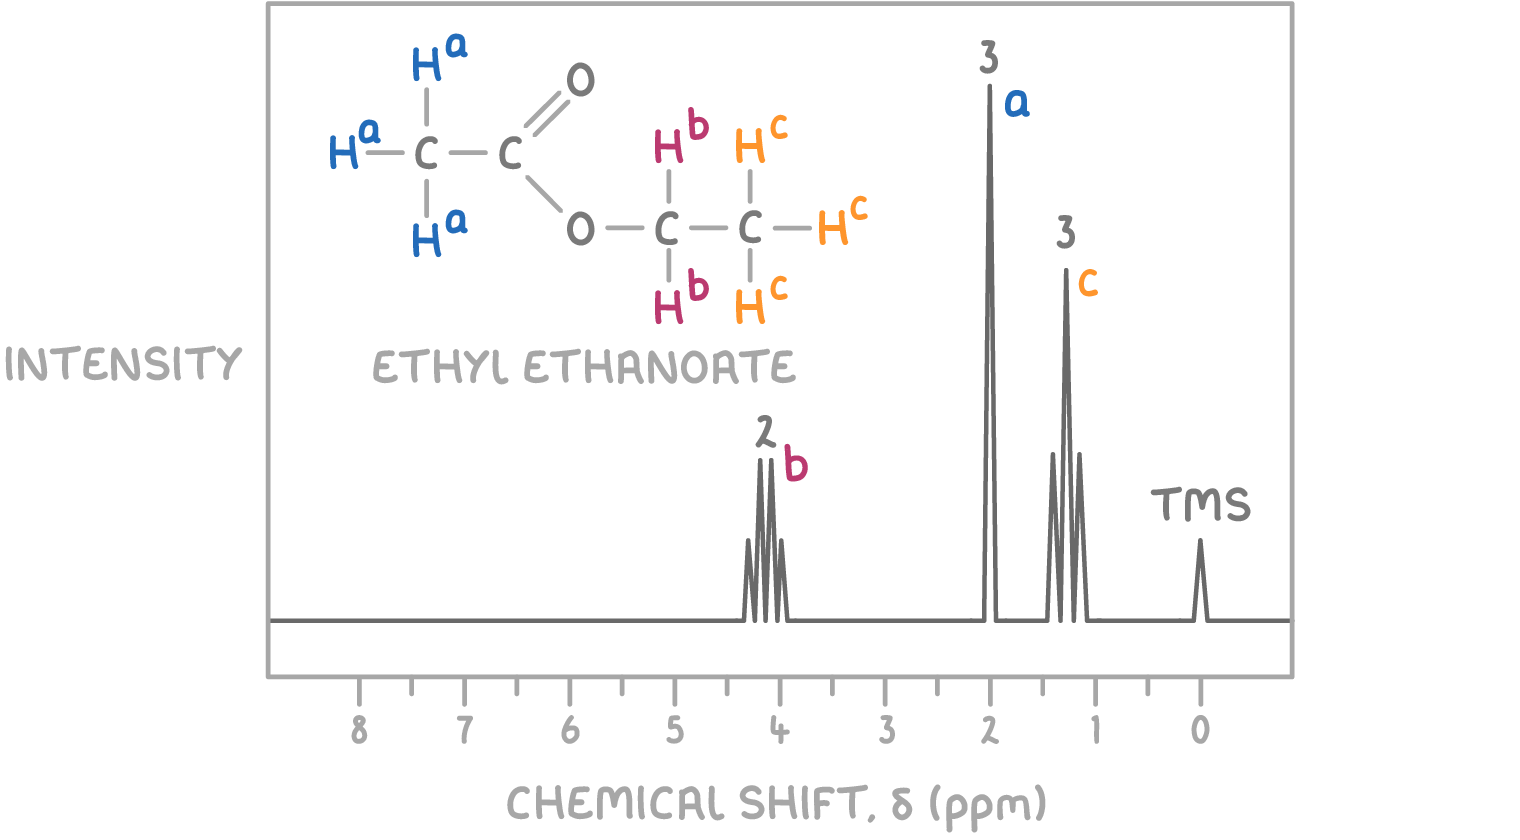
The structure that fits all these criteria is ethyl ethanoate, where the ethyl (CH3CH2-) part is responsible for the triplet and quartet, and the ethanoate (CH3COO-) part accounts for the singlet.
Therefore, the unknown molecule is identified as ethyl ethanoate.