Brønsted-Lowry Theory of Acids and Bases - exam practice
Brønsted-Lowry Theory of Acids and Bases
Question 1 of 3
Acid–base titration pH curves can be used to help choose suitable indicators for the following titrations:
- Titration A: 0.200 mol dm-3 NaOH(aq) was added from a burette to 25.0 cm3 of 0.200 mol dm-3 HCl(aq) until the NaOH was in excess.
- Titration B: 0.200 mol dm-3 NaOH(aq) was added from a burette to 25.0 cm3 of 0.200 mol dm-3 HCOOH(aq) until the NaOH was in excess.
Sketch a pH acid–base titration curve to show how the pH changes during titration A.
Sketch a pH acid–base titration curve to show how the pH changes during titration B.
Explain how the choice of indicator is linked to the pH curve.
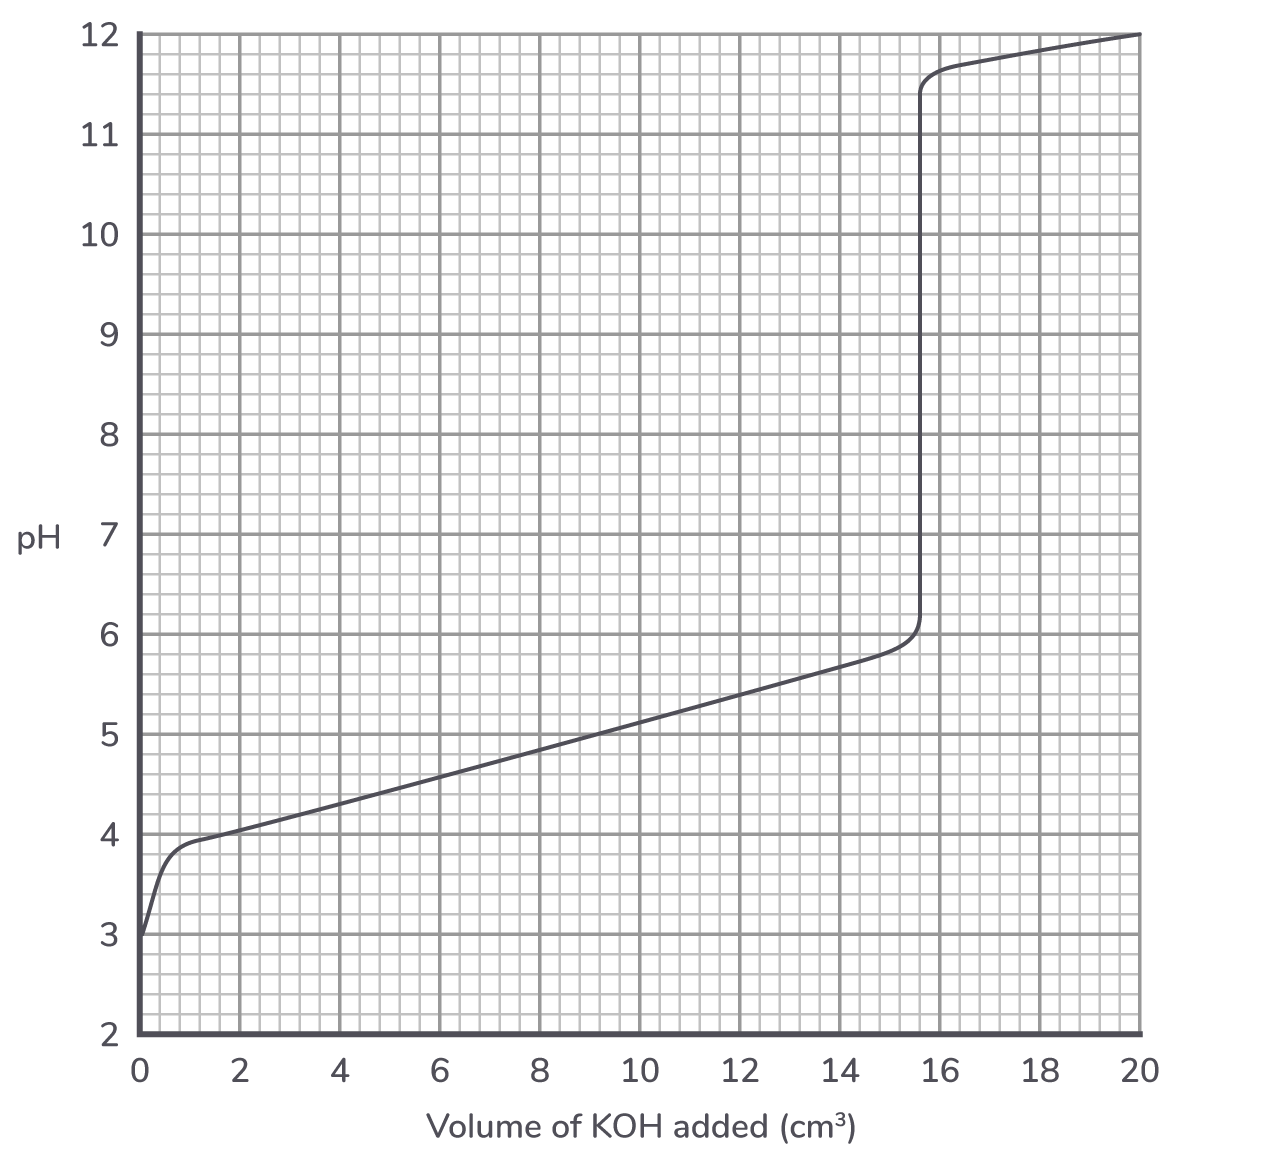
In a titration, a solution of potassium hydroxide was added gradually from a burette to a flask of ethanoic acid. The pH was measured and recorded at regular intervals.
The results are shown in the graph below.
The table below shows data about some indicators.
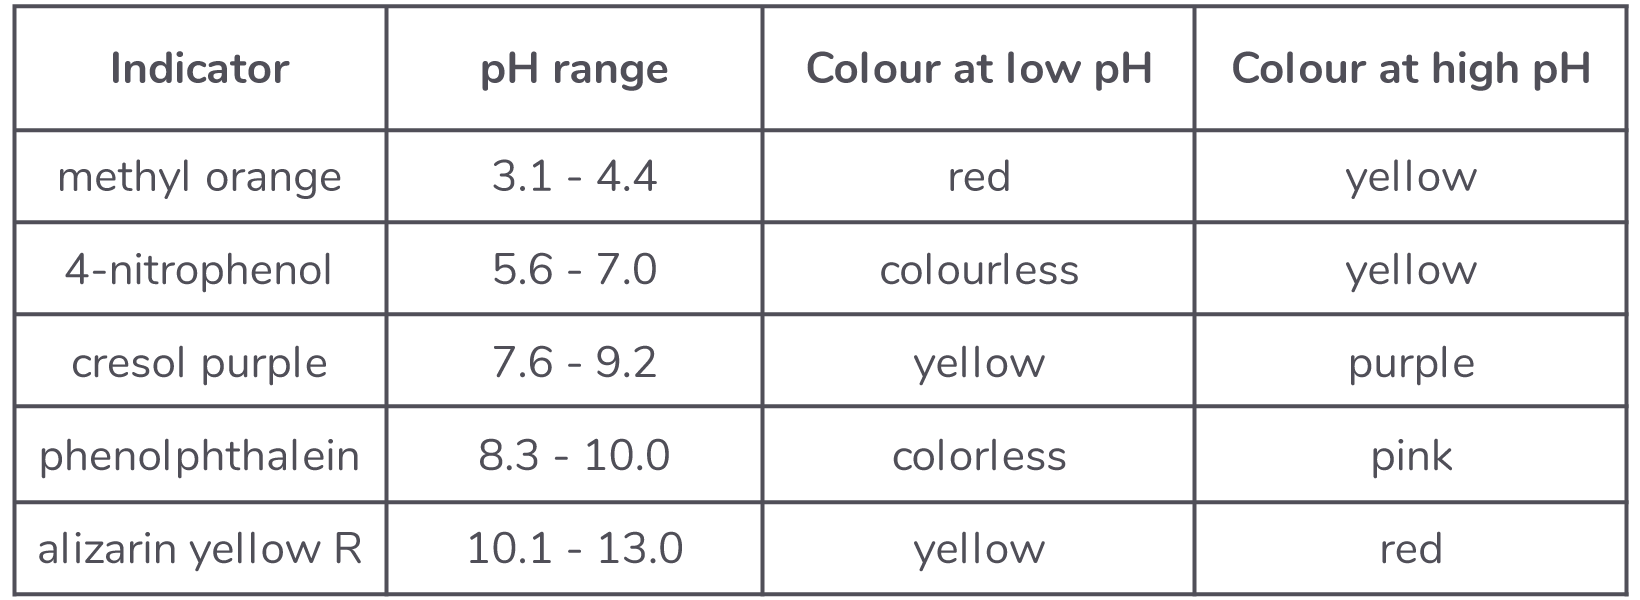
Explain which indicator(s) from the table would be suitable for this titration of ethanoic acid with potasium hydroxide.
A beaker contains 30 cm3 of a buffer solution at pH = 5.0.
Two drops of each of the five indicators in the table are added to this solution.
State the colour of the mixture of indicators in this buffer solution.
Assume that the indicators do not react with each other.
L and M are acids. Y and Z are bases. The table below shows the strength of each acid and base.
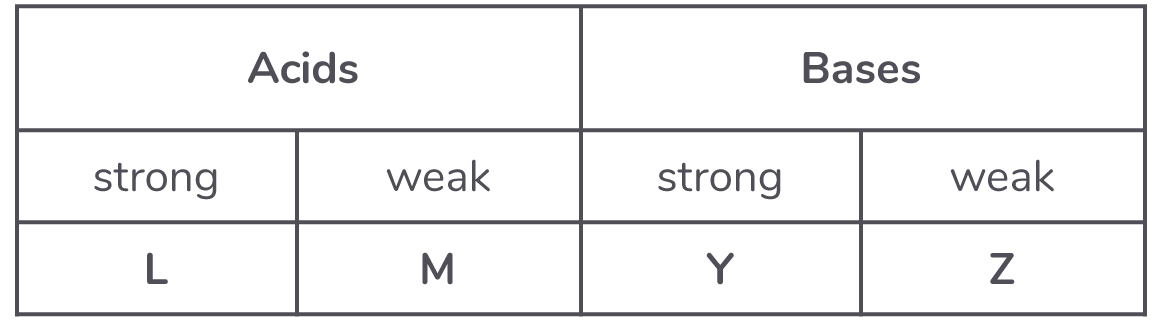
The two acids were titrated separately with the two bases using methyl orange as indicator.
The titrations were then repeated using phenolphthalein as indicator.
The pH range for methyl orange is 3.1– 4.4.
The pH range for phenolphthalein is 8.3 –10.0.
Select the correct statement about the indicator(s) that would give a precise end-point for the titration of:
Acid L with base Y.
Acid M with base Y.
Acid L with base Z.
Explain, why the end point of the reaction between acid M and base Z would be difficult to judge accurately using an indicator.