Gene Control - exam practice
Gene Control
Question 1 of 8
Steroid hormones, such as oestrogen, can influence the genome of a cell.
What is a genome?
In the cytoplasm, oestrogen binds to a specific androgen receptor.
Suggest and explain why oestrogen only binds to specific receptors.
The binding of oestrogen to an androgen receptor changes its shape, causing the oestrogen-receptor complex to enter the nucleus and stimulate gene expression.
Suggest how the oestrogen-receptor complex could stimulate gene expression.
Oestrogen can stimulate the growth of some types of breast tumour.
A drug known as tamoxifen can be used to treat these tumours.
In the liver, tamoxifen is converted into a substance known as endoxifen which has a similar shape to oestrogen.
Suggest how endoxifen may reduce the growth rate of breast tumours.
The diagram below shows the lac operon found within the genome of E. coli.
This operon contains both structural and regulatory genes. lacA is a structural gene that codes for a protein called transacetylase.
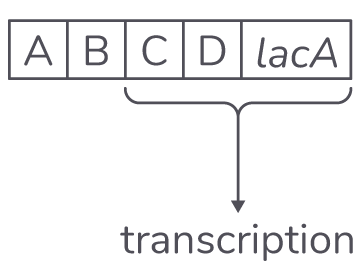
Describe the difference between structural and regulatory genes.
Name sections A and B of the lac operon shown in the diagram above.
Sections C and D of the lac operon shown above code for enzymes.
Name sections C and D in the diagram above and describe the function of the enzymes coded for by each section.
Describe and explain how the absence of lactose affects gene expression within the lac operon.
RNA produced from one gene can give rise to more than one type of protein.
The diagram below shows a part of this process.
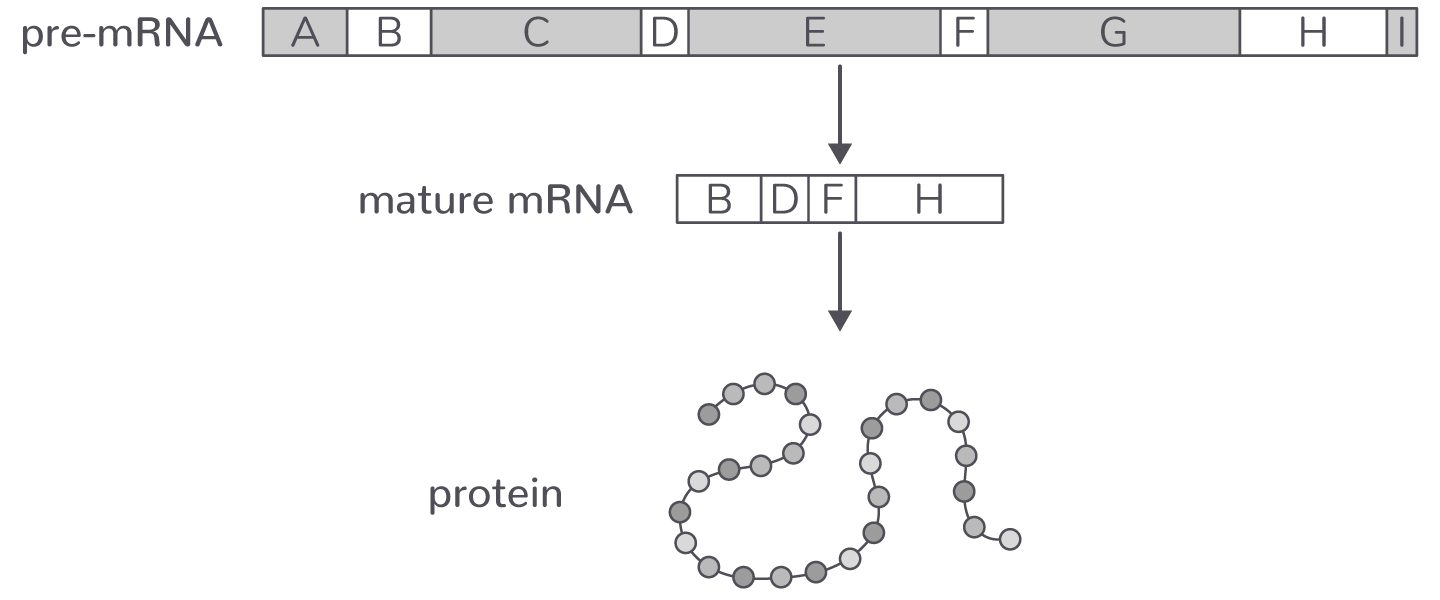
Use the diagram above to explain how RNA from one gene can produce more than one type of protein.
Beta cells in the pancreas produce the protein insulin to control blood glucose concentration.
Transcription factors are involved in the activation of the insulin gene.
Explain how transcription factors activate this gene.
Explain why beta cells can produce insulin but other cells within the pancreas cannot.
The diagram below shows the mechanism of action for a transcription factor that increases transcription.
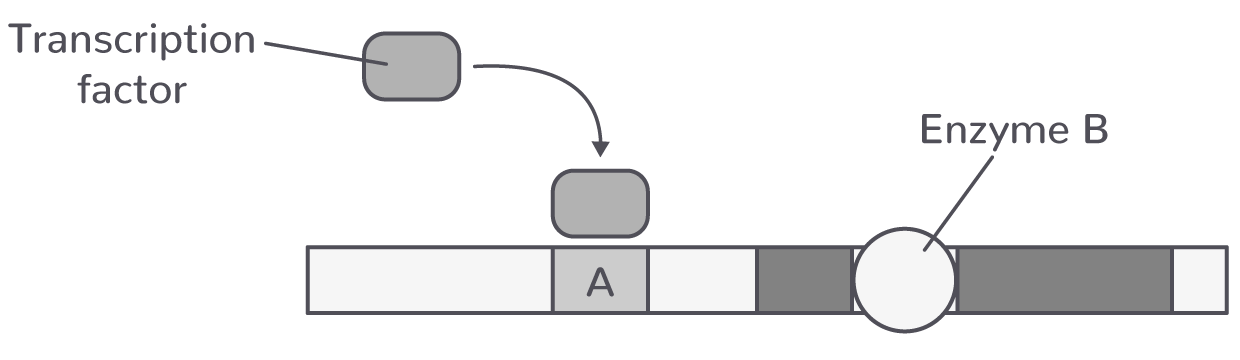
Name region A in the diagram above.
Name enzyme B in the diagram above.
Use the diagram above to explain how transcription factors can increase the rate of transcription.
Some transcription factors are activators, meaning they increase the rate of transcription.
Explain how a transcription factor may function as a repressor.
The diagram below shows the functioning of the lac operon when bacteria are exposed to lactose.
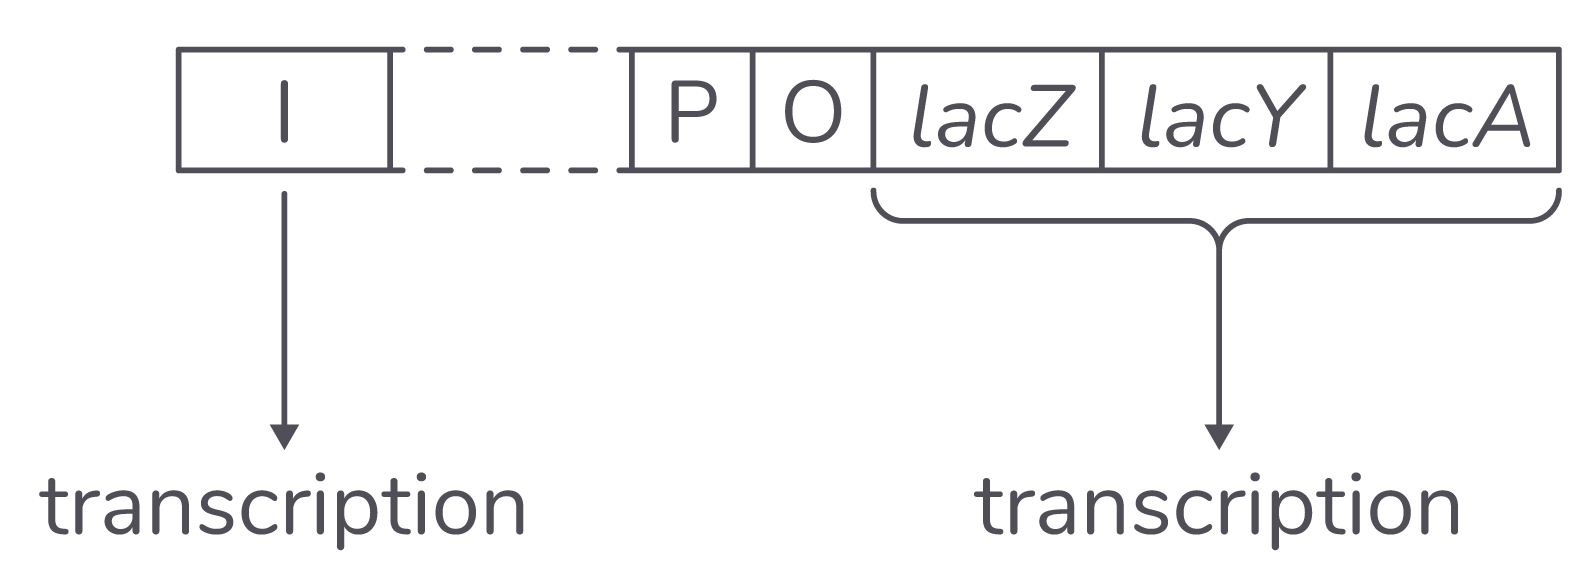
The lac operon consists of structural and regulatory genes.
Name the products of two structural genes within the lac operon.
Gene I is located a short distance away from the lac operon.
The product of this gene is a constitutive protein.
What is a constitutive protein?
Explain how the presence of lactose affects gene expression in the lac operon.
The structural genes of the lac operon are not expressed in the absence of lactose.
Explain why this is beneficial to E. coli.
The diagram below shows the trp operon found in many prokaryotes.
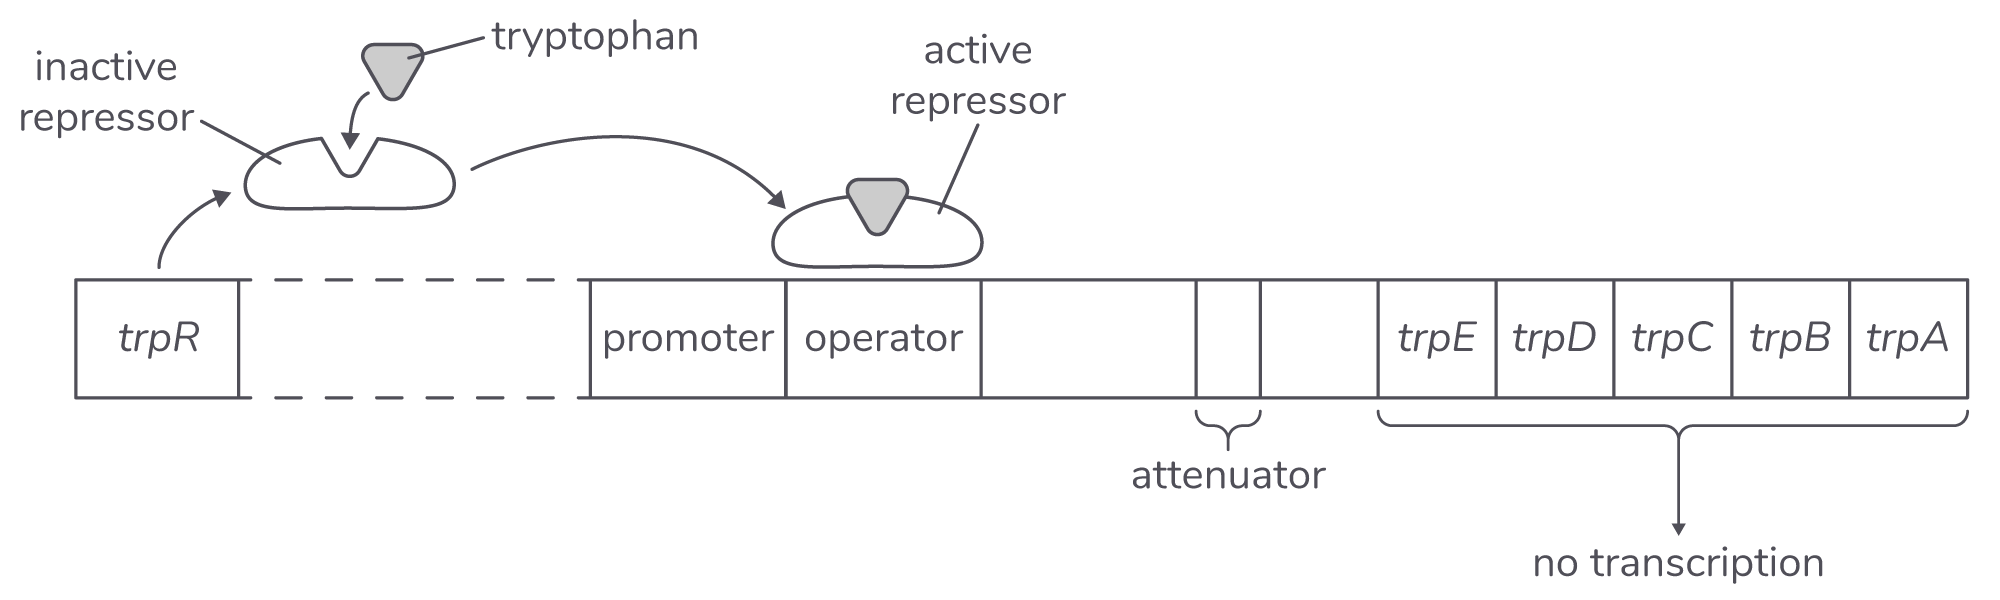
The gene trpA codes for the enzyme tryptophan synthase.
This enzyme catalyses the formation of the amino acid tryptophan.
Explain why tryptophan synthase is an example of a repressible enzyme.
Describe three similarities between the structure of the lac operon and the trp operon.
Describe two differences between the functioning of the lac operon and the trp operon.
A strain of bacteria has been produced with a mutation in the trpR gene, resulting in a non-functional repressor protein.
Suggest a negative effect that this mutation will have on this strain of bacteria.
In plants, gene expression involves hormones such as gibberellin and proteins such as JAZ and MYC.
Describe how gibberellin activates genes responsible for the elongation of stems.
MYC proteins bind to DNA, allowing transcription to begin.
What term is used to describe proteins such as MYC proteins?
Explain the role of the gene controlling stem length in pea plants.
The diagram below shows how hormones and transcription factors can control transcription of a gene.
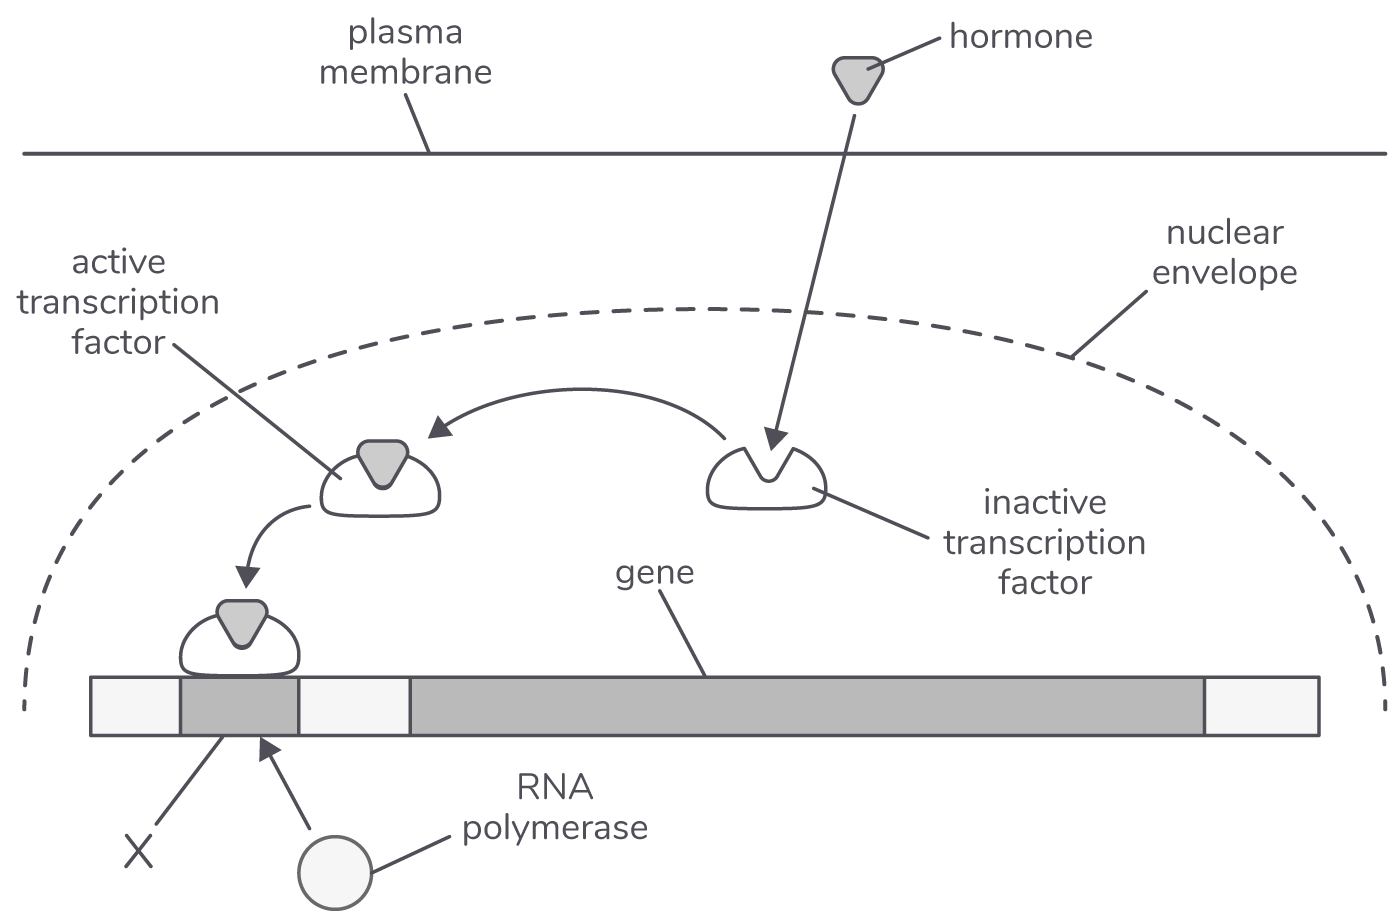
Name region X in the diagram above.
Use the diagram above to describe how transcription can be controlled in eukaryotes.
Explain how gene expression can be regulated after the process of transcription.