10.7 - Measuring Variation
- 1
Random sampling
- 2
Mean, median, and mode
- 3
Standard deviation and error bars
Random sampling
It is often impractical or impossible to measure every single individual when investigating population traits. Random sampling is important to avoid bias and ensure the samples are representative of the whole population.
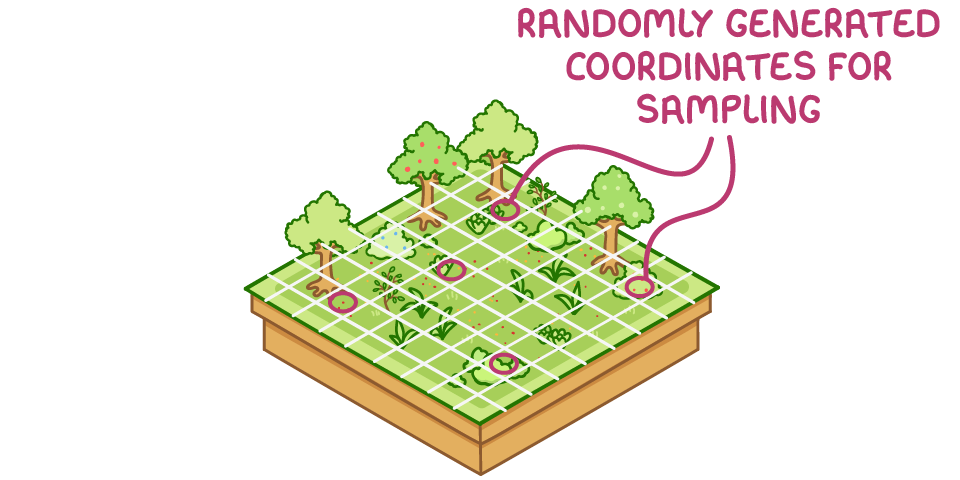
Random sampling involves:
- Randomly generating coordinates across an area to prevent sampling bias.
- Collecting samples from these random coordinates to represent the population.
- Repeating this several times as a large sample size minimises the effects of chance.
- Analysing the data collected to identify any relationships.
Mean, median, and mode
There are three types of average value that can be collected about a sample: the mean, median, and mode.
How to calculate these average values:
- Mean - The sum of the sampled values divided by the number of values.
- Median - The central or middle value of a set of values.
- Mode - The single value of a sample that occurs most often.
Most samples with values either side of the mean will be normally distributed. A normal distribution curve is bell-shaped and symmetrical around a central mean value.
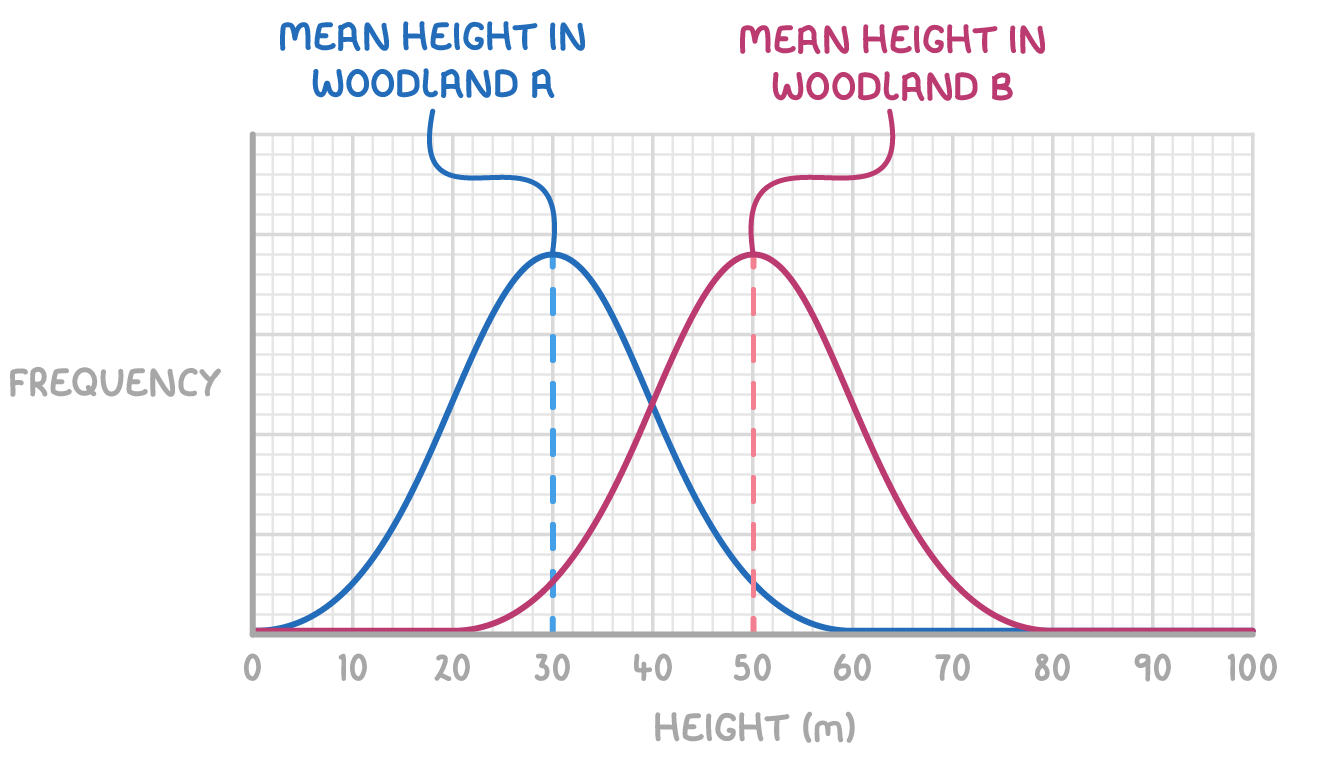
Comparing mean values, shown as the maximum height of the normal distribution curve, helps identify variation between separate samples.
For example:
- Mean tree height in sample of woodland A = 30 m.
- Mean tree height in sample of woodland B = 50 m.
This 20 m difference shows clear variation between the samples, implying variation between the actual woodland tree populations.
Standard deviation
The standard deviation measures spread of values around the mean within a sample.
How to interpret standard deviation values:
- Small standard deviation - The values are fairly consistent and clustered around the mean.
- Large standard deviation - The values are fairly inconsistent and widely spread around the mean.
The mean height of woodland A in the example above can be represented as 30 m ± 5 m:
- This means that the mean is 30 and the standard deviation is 5.
- Most (~68%) values lie between 25 m and 35 m.
To calculate the standard deviation, we use the following formula (this will be provided):
Where:
Error bars
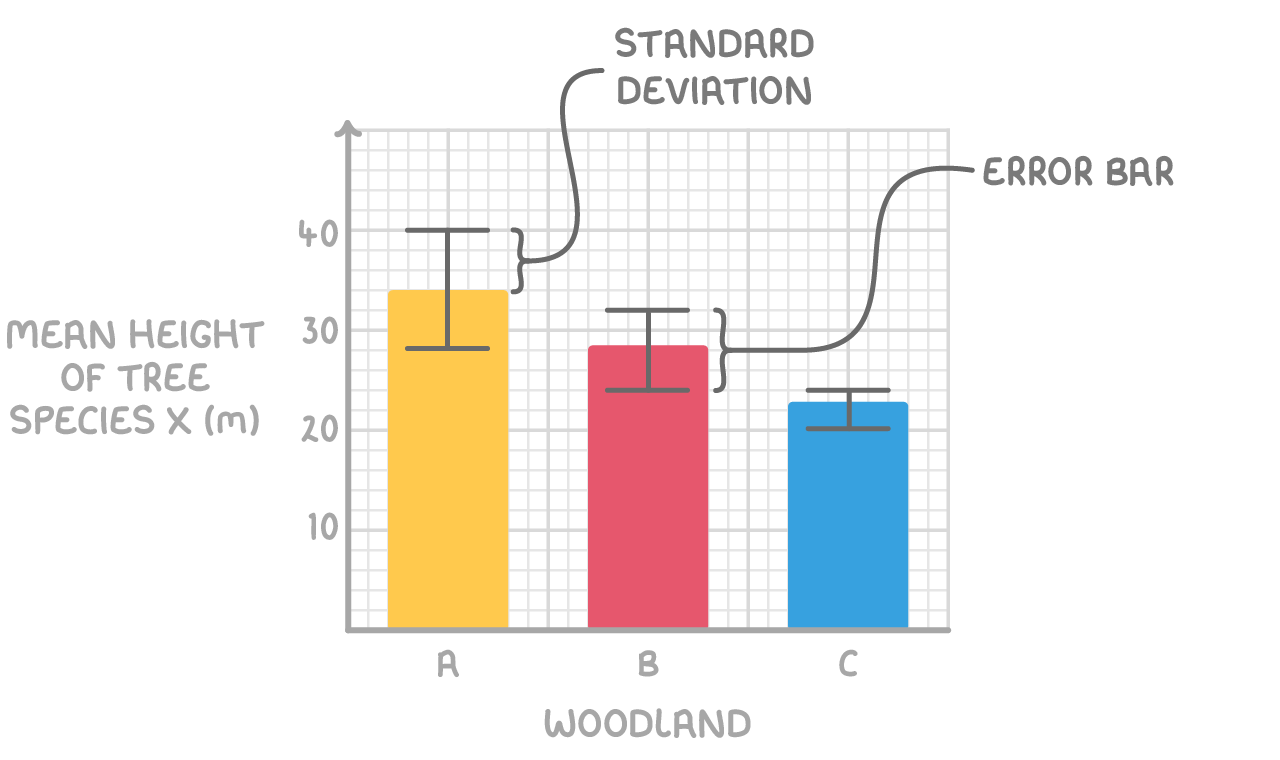
Error bars display the standard deviation visually:
- They are plotted one standard deviation above and below the mean.
- The error bar length shows degree of value spread in the sample.
- Longer error bars indicate more variation around the mean within that sample.
Worked example - Quantifying tree height variation using standard deviation
Calculate the standard deviation of tree heights in a sample from woodland A using the following data collected for tree heights: 32 m, 35 m, 31 m, 29 m, and 33 m.
Step 1: Equation
Step 2: Calculate the mean
Step 3: Calculate for each tree height
for each tree height, subtract the mean and square the result
Step 4: Summation and division
sum all squared differences and divide by
Step 5: Square root the value from step 4
take the square root of this value to get the standard deviation