18.4 - Pearson's Correlation Coefficient
- 1
What correlation is
- 2
Calculating and interpreting Pearson's correlation coefficient
What is correlation?
Correlation refers to the relationship between two variables.
The correlation can be:
- Positive - This is when both variables increase or decrease together.
- Negative - This is when one variable increases as the other decreases.
- Non-existent - This is when there is no clear relationship, indicated by a correlation coefficient close to 0.
A correlation coefficient of 1 indicates a perfect, positive linear correlation, where all points lie on a straight line.
Calculating Pearson's correlation coefficient
Pearson's correlation coefficient (r) assesses the strength and direction of a linear relationship between two continuous variables that are normally distributed, x and y.
The formula is (this will be provided in an exam):
Where:
- represents the sum of.
- is the mean (average) of all x values.
- is the mean (average) of all y values.
The process for calculating Pearson's correlation is:
- Calculate the mean of each variable.
- Subtract the mean from each observed value ( and ).
- Square the values calculated in step 2 ( and ).
- Multiply together the values calculated in step 2 ().
- Sum the values calculated in steps 3 and 4.
It may be helpful to carry out steps 2 to 5 in a table like shown below:
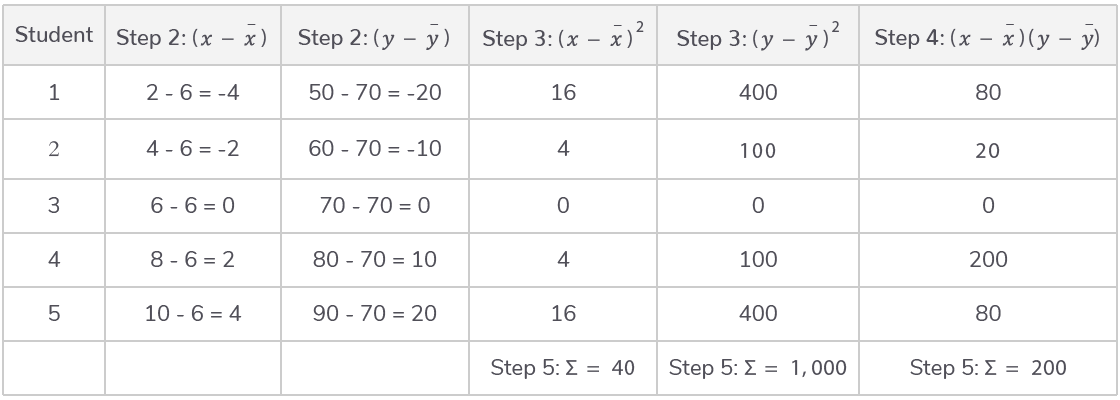
Then, substitute these values into the equation to find the Pearson’s correlation coefficient (r).
Finally, compare the calculated r value to a critical value at a 5% significance level. For this test, the .
This determines the significance of the correlation:
- An r value near +1 indicates a strong positive correlation.
- An r value near -1 suggests a strong negative correlation.
- An r value around 0 implies there is no correlation.
Worked example - Calculating Pearson's correlation coefficient
Is there a correlation between height and weight based on the following data for 5 individuals?
| Individual | Height (cm) | Weight (kg) |
|---|---|---|
| 1 | 175 | 65 |
| 2 | 168 | 60 |
| 3 | 180 | 80 |
| 4 | 165 | 55 |
| 5 | 170 | 68 |
Step 1: Equation
Step 2: Calculate the means and
Step 3: Construct a table to calculate the differences from the mean and their products
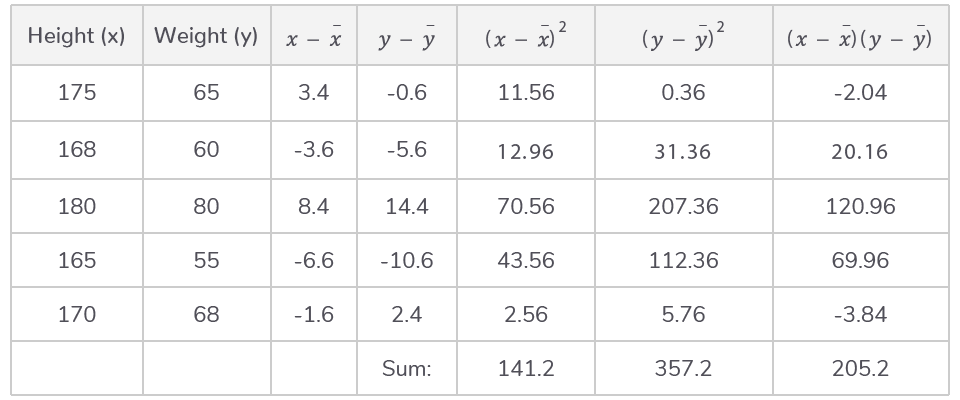
Step 4: Substitution and correct evaluation
Step 5: Determine significance and interpret result
for a sample size of 5, , the critical value at the 5% significance level is 0.878
as the value of 0.914 exceeds this critical value, the correlation between height and weight is statistically significant, and is unlikely to be due to chance
this indicates a strong positive correlation between height and weight among the individuals in this sample, suggesting that as height increases, weight also increases