Mass Transport in Animals: Haemoglobin - exam practice
Mass Transport in Animals: Haemoglobin
Question 1 of 6
The diagram below shows the structure of a haemoglobin molecule.
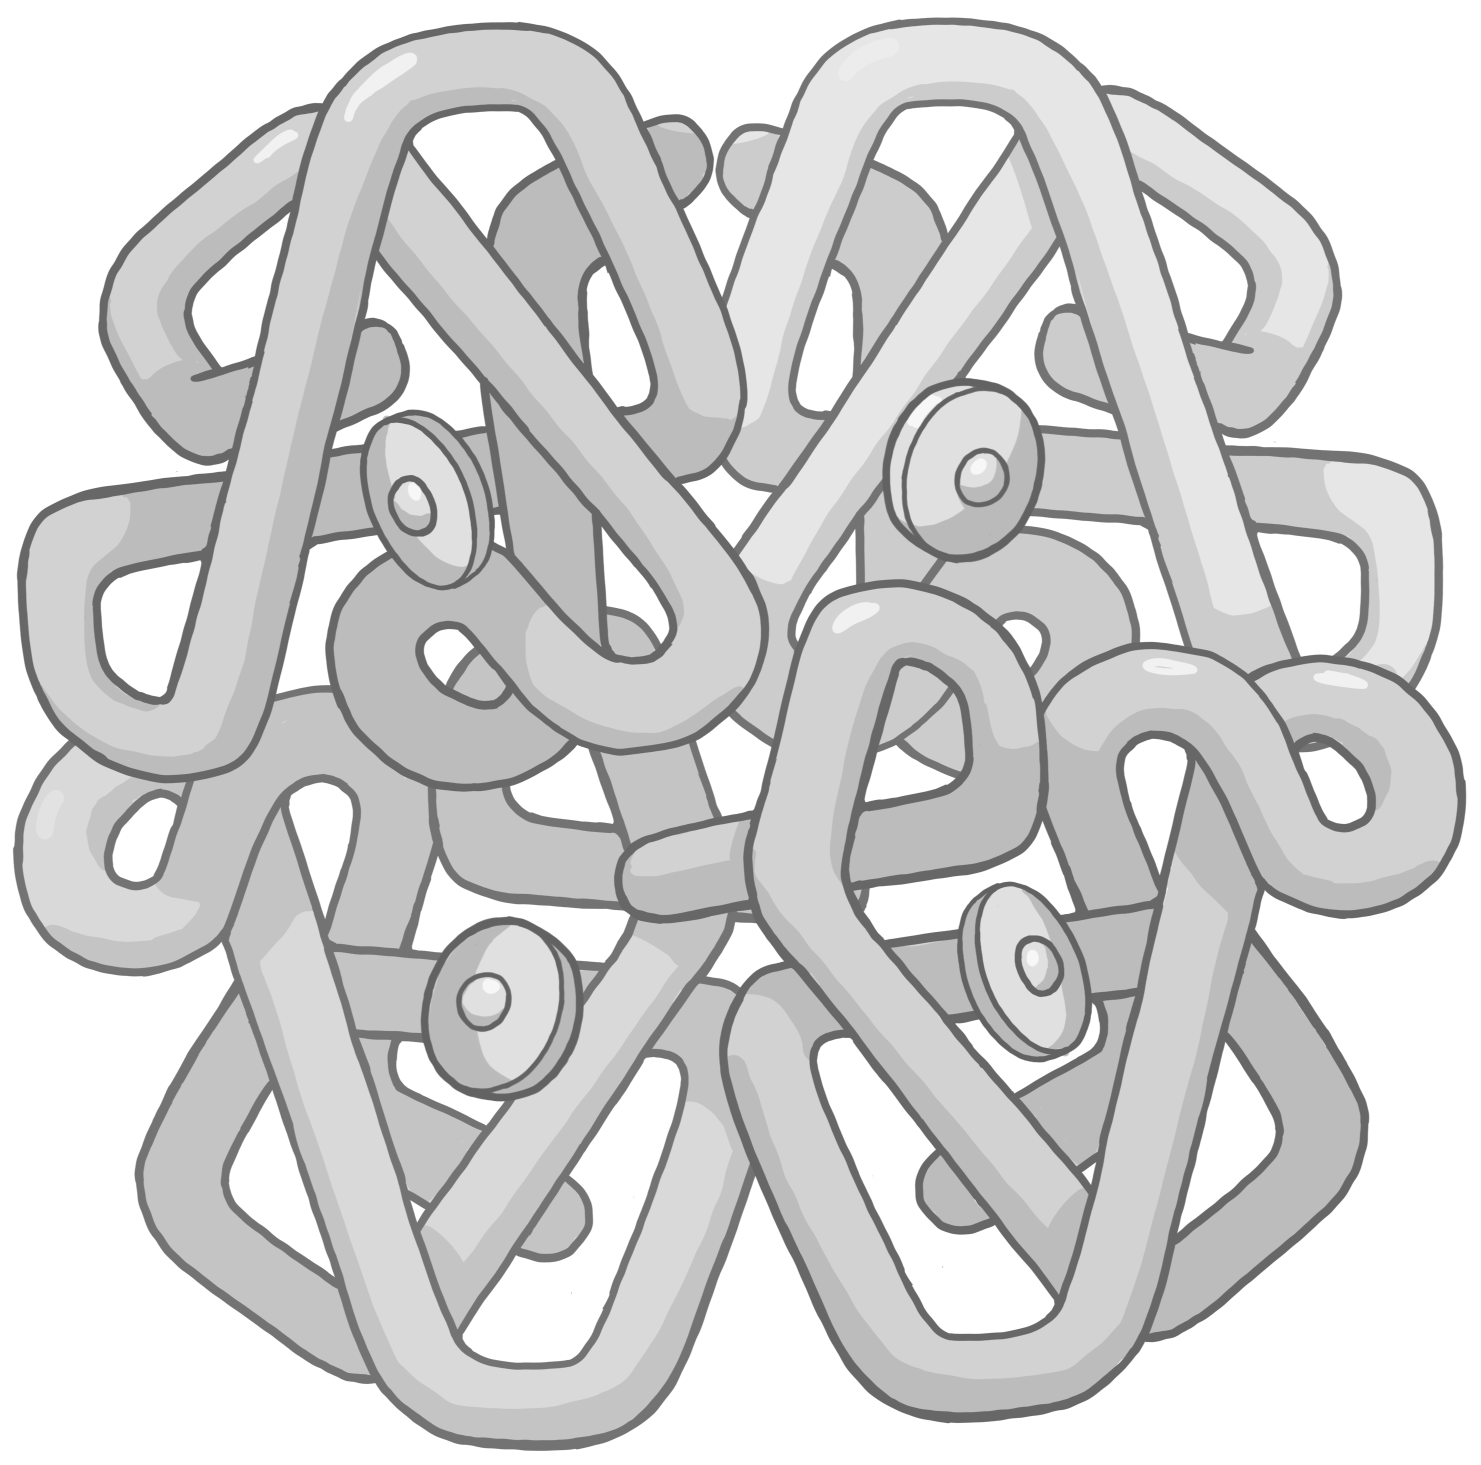
Describe the evidence that haemoglobin has a quaternary structure.
Explain how the structure of haemoglobin enables efficient transport of oxygen.
Haemoglobin is responsible for carrying oxygen around the body.
Explain why the binding of one oxygen molecule to haemoglobin makes it easier to bind a second oxygen molecule.
An increase in carbon dioxide concentration affects the dissociation of oxyhaemoglobin.
Describe and explain how.
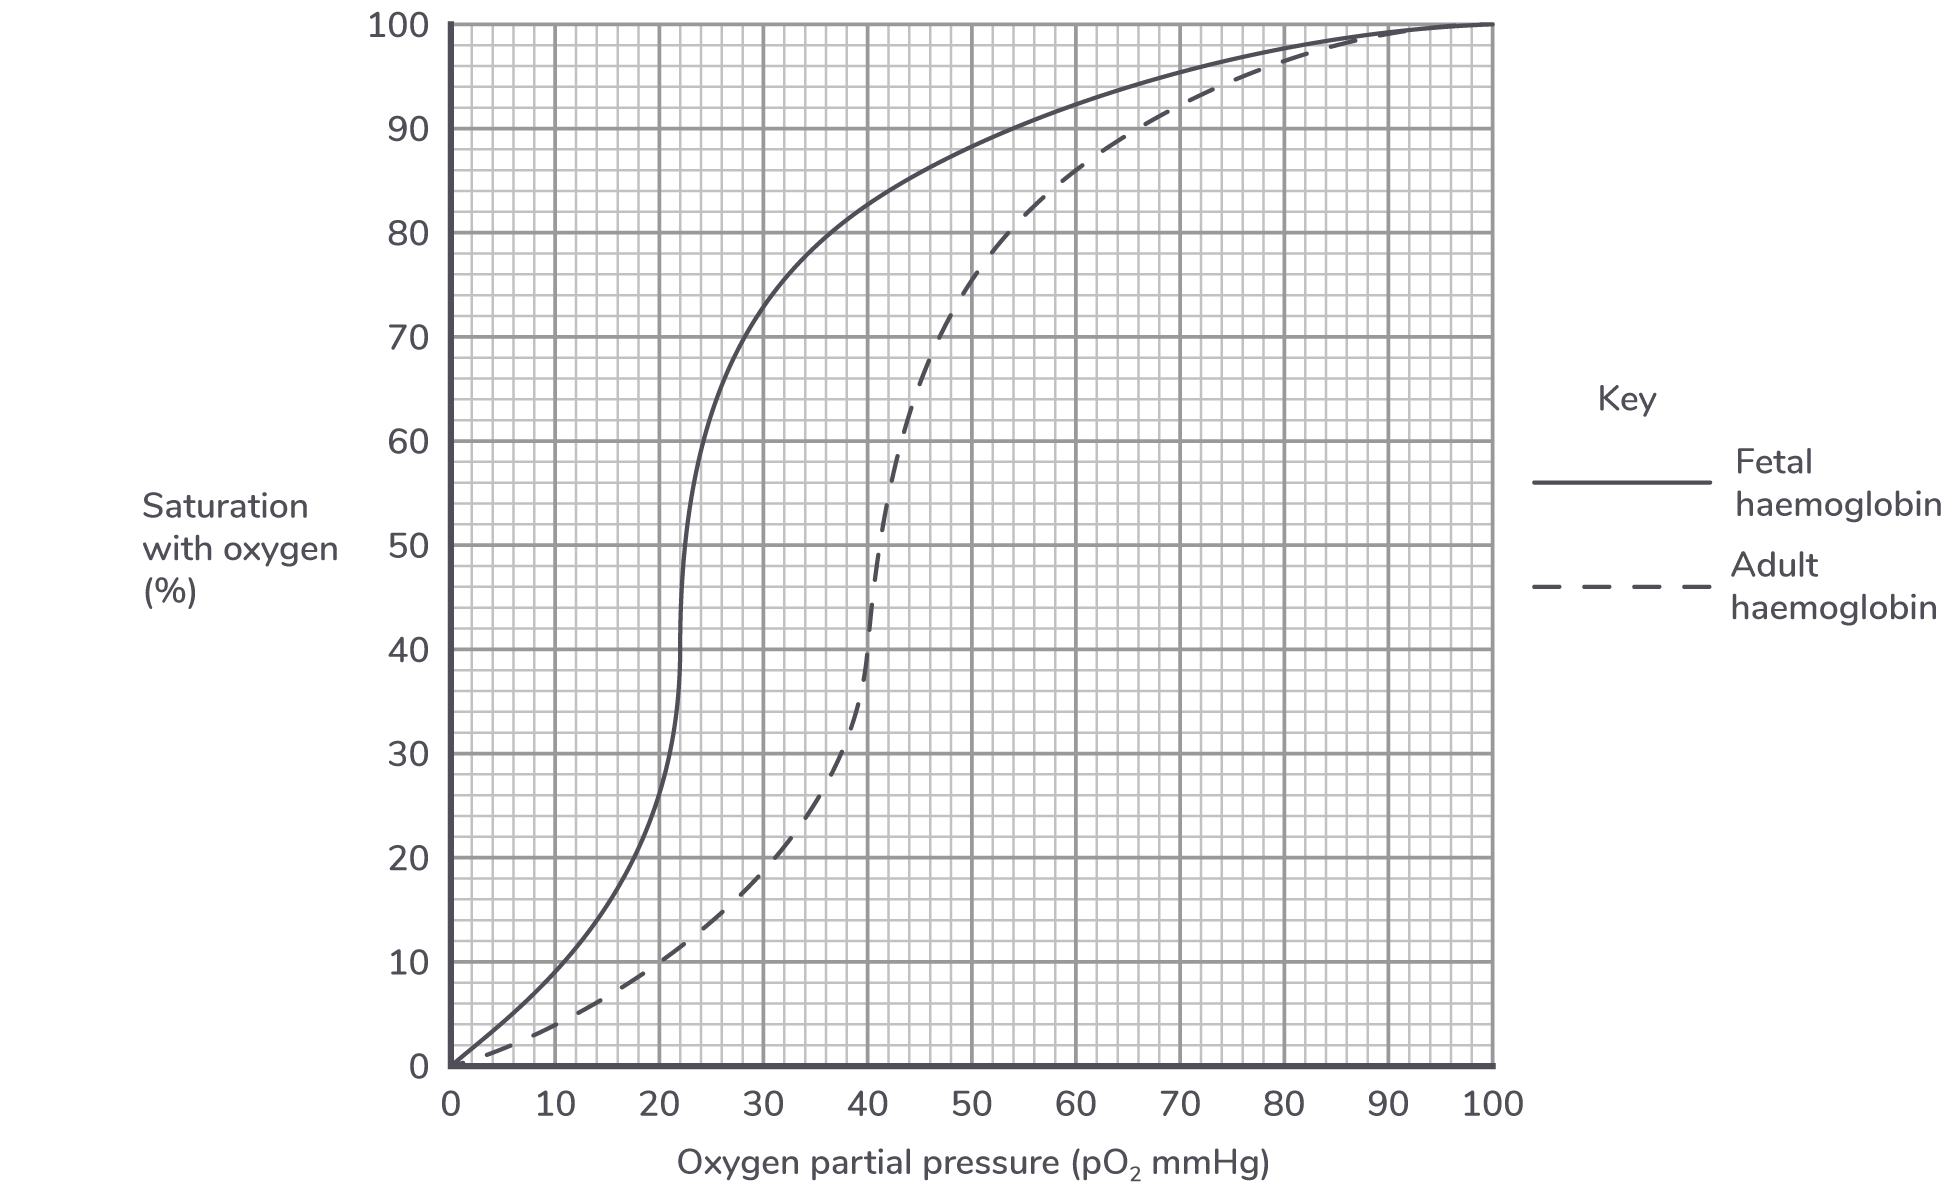
The diagram below shows the oxygen dissociation curves for adult and fetal haemoglobin.
The first oxygen molecule to bind to haemoglobin causes a change in the shape of the haemoglobin.
This makes it easier for other oxygen moelcules to bind to haemoglobin.
Explain how the graph above provides evidence for this.
Explain why the curve for fetal haemoglobin is to the left of the curve for adult haemoglobin.
After birth, adult haemoglobin replaces fetal haemoglobin.
Explain why this is advantageous for the baby.
Describe and explain how an increased rate of respiration in adults affects the oxygen dissociation curve of haemoglobin.
Red blood cells contain haemoglobin.
Describe the role of haemoglobin in transporting oxygen to tissues around the body.
Explain why red blood cells do not use the oxygen they transport.
The diagram below shows the oxygen dissociation curves for mountain goat haemoglobin and sheep haemoglobin.
Sheep live at sea level whereas mountain goats live at high altitudes.
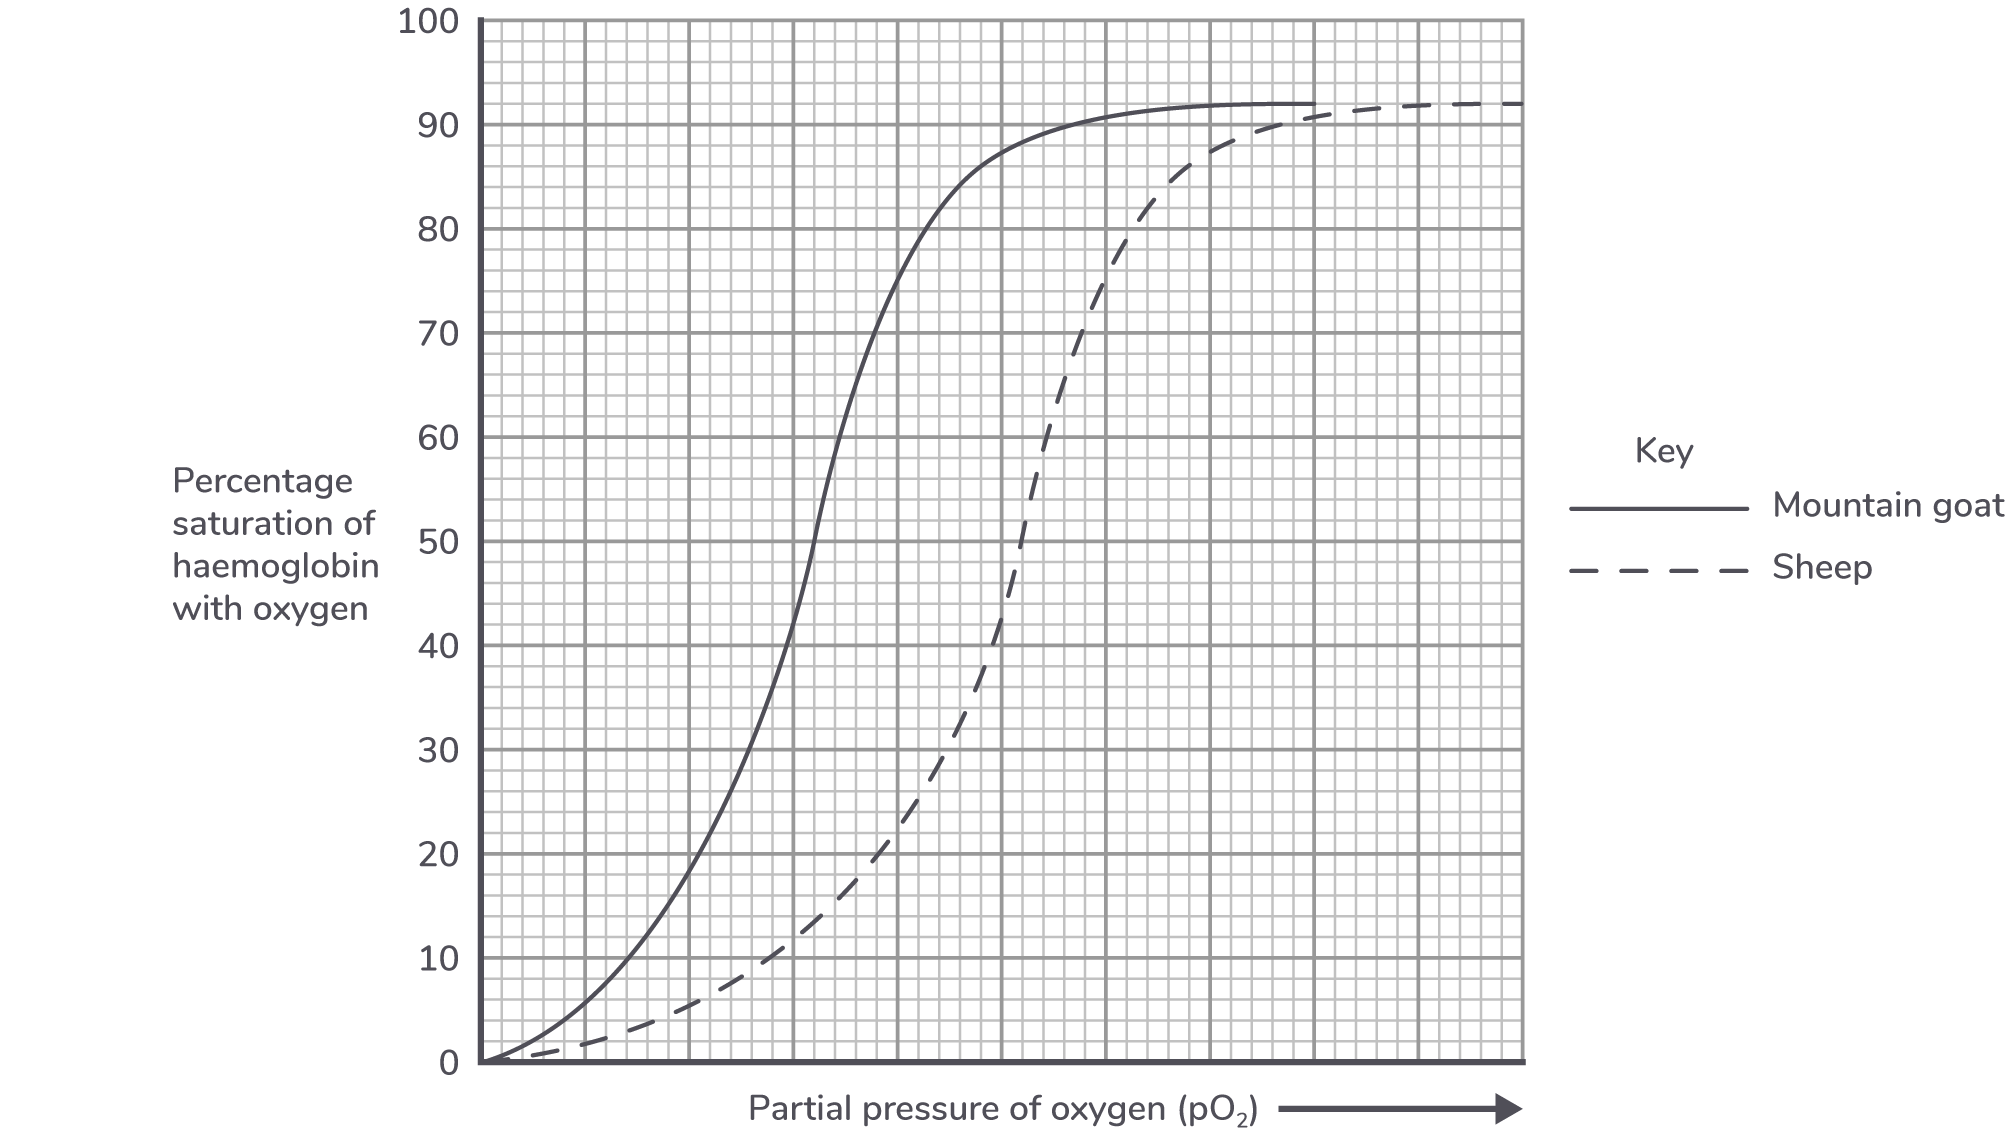
Explain the advantage to the mountain goat of having haemoglobin with a dissociation curve as shown above.
Explain why red blood cells are found in the blood but not in the tissue fluid.
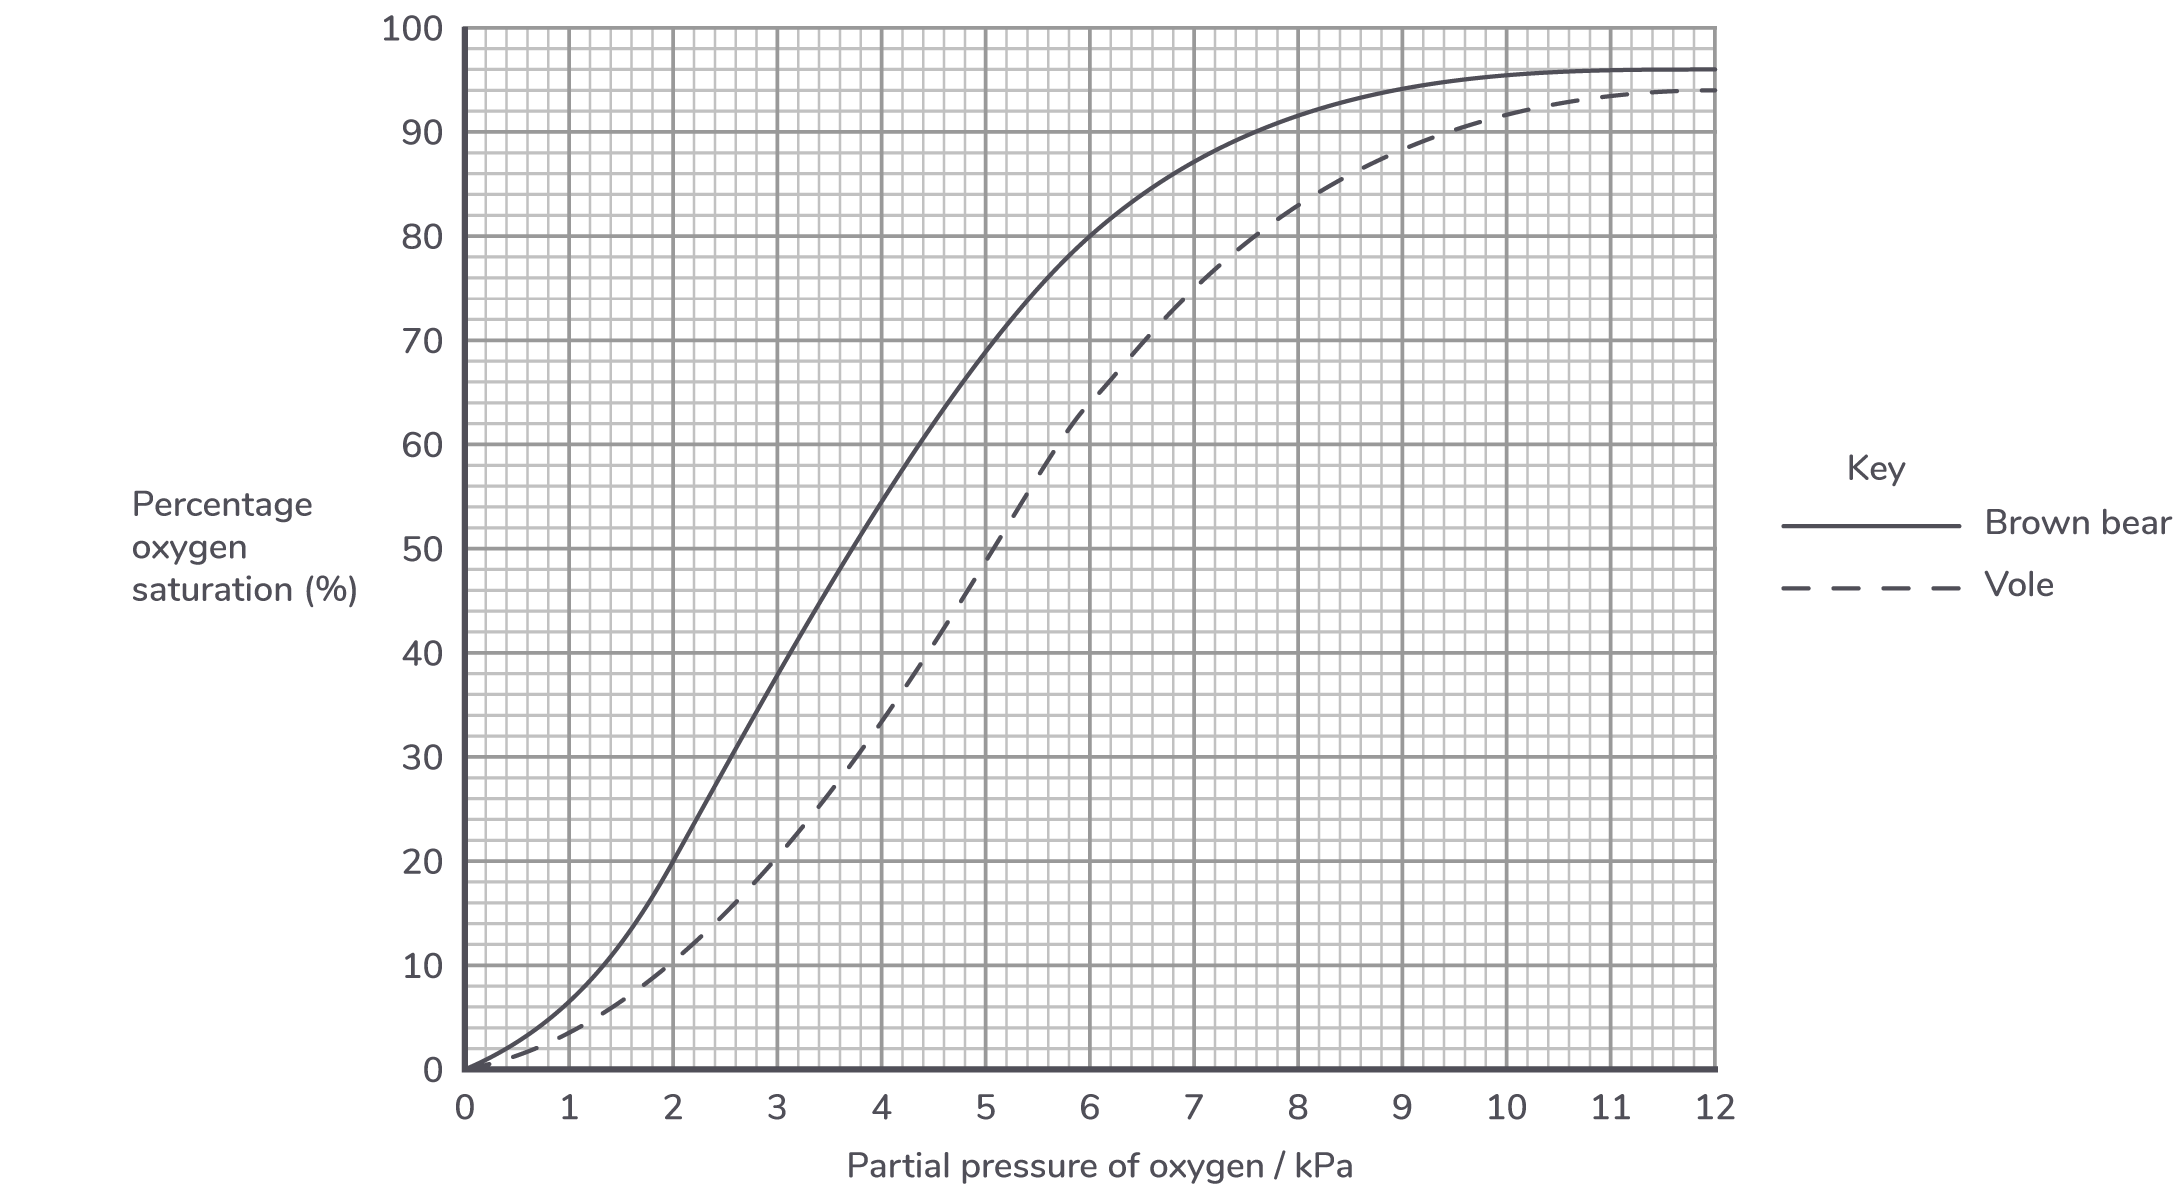
The diagram below shows the oxygen dissociation curves for two mammals, a brown bear, and a vole.
State what is meant by the term partial pressure.
Suggest how the differences between the two dissociation curves shown above allow the vole to have a higher metabolic rate than the bear.
Using the diagram above, describe the relationship between the size of mammals and their oxygen dissociation curves.
Mammals use respiration to help maintain a constant body temperature.
Explain the link between an mammal’s surface area to volume ratio and their oxygen dissociation curve.
The diagram below shows oxygen dissociation curves at different concentrations of carbon dioxide.
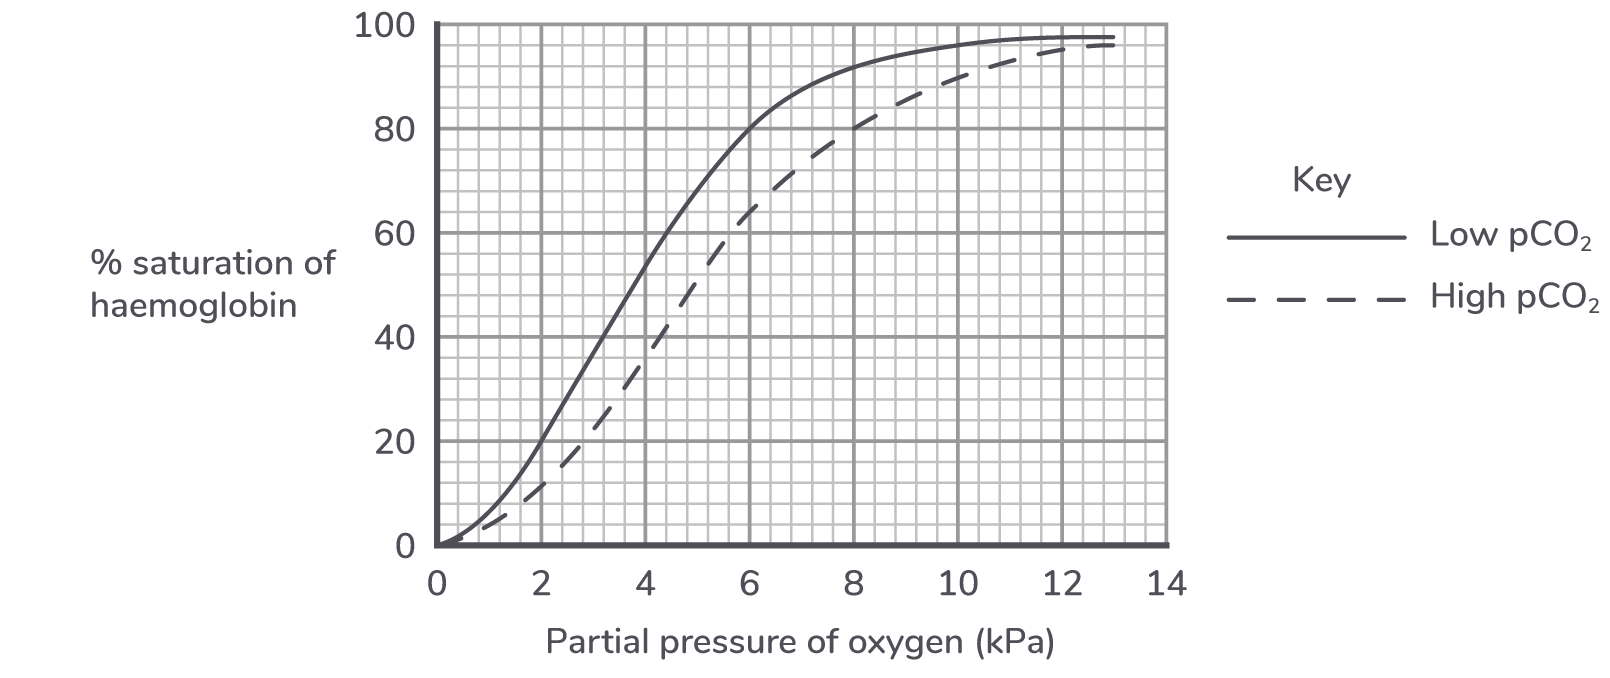
Calculate the difference in the saturation of haemoglobin between low and high pCO2 at 2 kPa.
Use the graph above to describe the effect of increasing carbon dioxide concentration on the dissociation of oxyhaemoglobin.
What name is given to the effect shown in the diagram above?
Haemoglobin releases oxygen more readily to actively respiring tissues than to resting tissues.
Explain why.
The diagram below shows the dissociation curve for human haemoglobin.
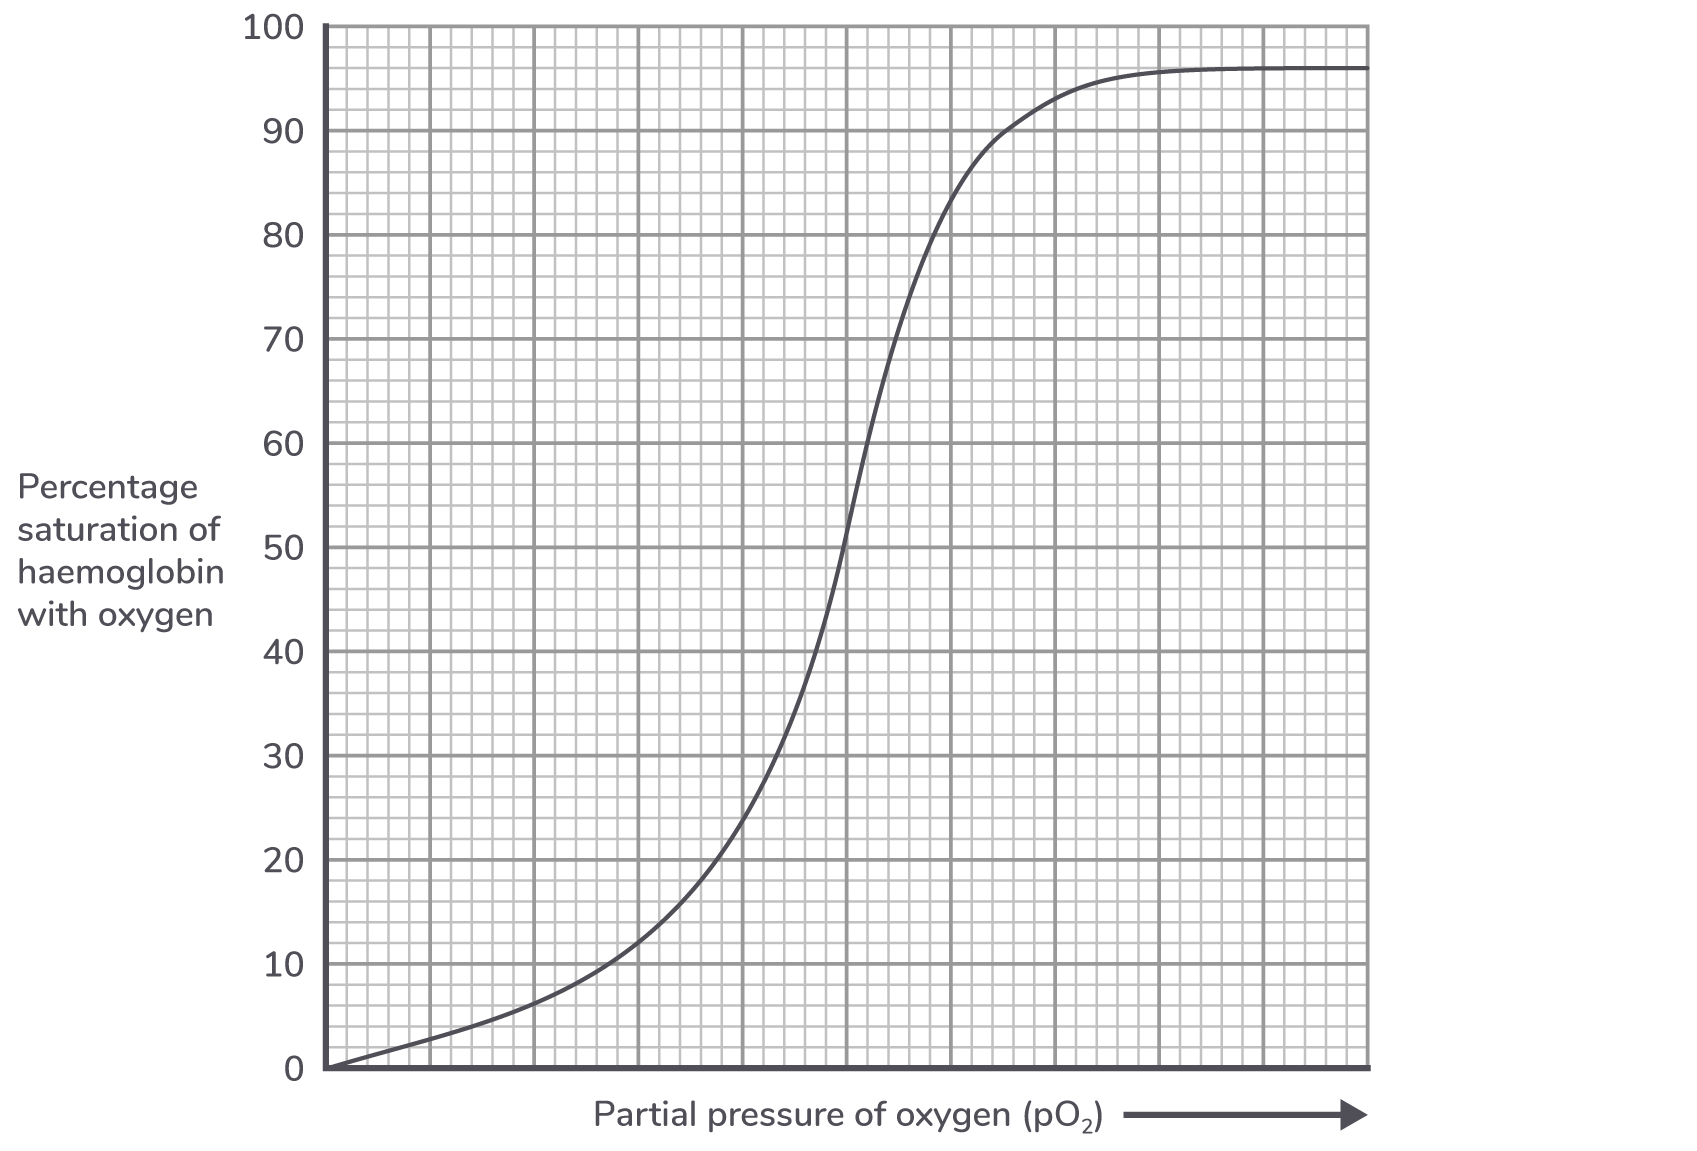
Explain the shape of the haemoglobin dissociation curve.
Sketch a curve on the graph to show the expected dissociation curve at a lower pH.
Explain how aerobic respiration in tissues leads to a lower blood pH.
Explain the advantage of a lower blood pH during aerobic respiration.